
Fra Zerohedge:
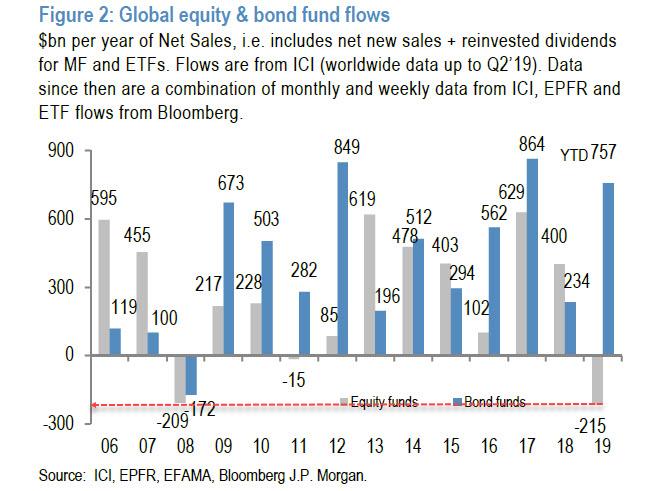
equity fund outflows in 2019, the best year for the S&P since 2013, are on pace to surpass even the financial crisis year of 2008 some $209 billion in funds was redeemed; meanwhile so far in 2019, the YTD total is a record $215 billion… and yet the S&P keeps hitting new record high after record high. What gives?
As SocGen writes, picking up where we left off back in June, “the answer to this conundrum can partly be found in the reduced trading volume on the US equity market and the massive wave of buybacks over the past two years in the aftermath of President Trump’s Tax Cuts and Jobs Act (TCJA). In recent weeks, with the de-escalation of the US/China trade war, we think market participants have started to price in a potential improvement in the soft data indicators, and this could go on for a while if the de-escalation momentum continues.”
So what happens next? Well, if one looks at the Conference Board US Leading Economic Index, one can see that the US has undergone three mini-cycles since the 2007 Great Financial Crisis (GFC). Meanwhile, as SocGen’s Alain Bokobza writes, “the announcement of “Phase 1” agreement on the 11 October 2019 by President Trump, after 463 days of twists and turns between US/China was welcomed and came as a relief to the financial markets, lifting in a dramatic way the price of risky assets.”
Which lays out the key question for 2020 as framed by the French bank: “market participants have started to factor-in the start of a fourth mini-cycle. Can it last?”
To answer this question, one first has to look at how we got to where we are in 2019, and here SocGen echoes Goldman’s recent assessment, pointing out that if one looks at a breakdown of S&P 500 total returns, we can make two observations: First, since October 2018, the market’s performance has been driven entirely by earnings growth, while P/E has been a negative contributor: end-2018 recession fears and Fed tightening are factored into the numbers. Second, and more importantly, the Fed’s dovish shift in early 2019 facilitated an extraordinary P/E expansion. Indeed, as shown in the chart below, since January 2019, the biggest contributor by far to S&P returns has been PE expansion.
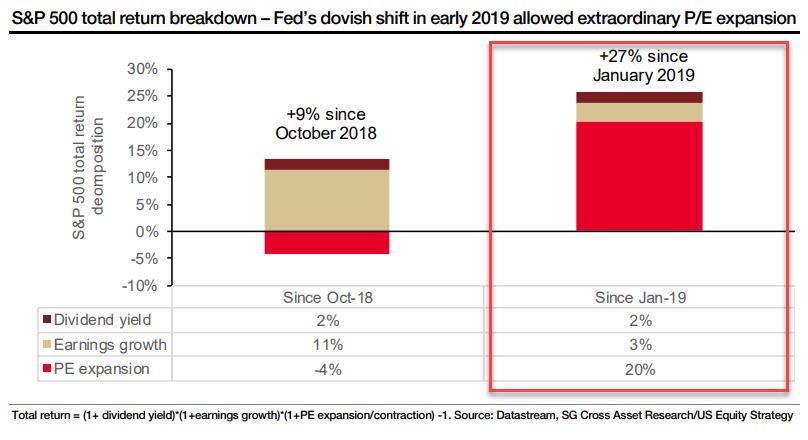
As a reminder, this is what Goldman said last week in its own 2020 year ahead preview: “With S&P 500 earnings on track for roughly zero growth from this time last year, solid returns likely would not have been possible without central bank support.” Of course, 2019 was a year in which both the Federal Reserve and the European Central Bank eased monetary policy, pushing long-term real interest rates down about 100bp in the US and 50bp in the Euro area. About how much did this lift risky assets? A standard approach based on the equity risk premium concept would say that central bank intervention accounted “for almost all of the price return since the start of the year.” That’s not us, that’s Goldman.
Why is the above important? Because to have a view on asset returns in 2020 one has to understand what caused the market’s impressive 24% increase in 2019. Here, as SocGen notes, the question to ask is “what drove this P/E expansion since the start of the year, apart from the Fed’s dovish shift? And is that sustainable? Buybacks and a lack of market liquidity played a major role.”
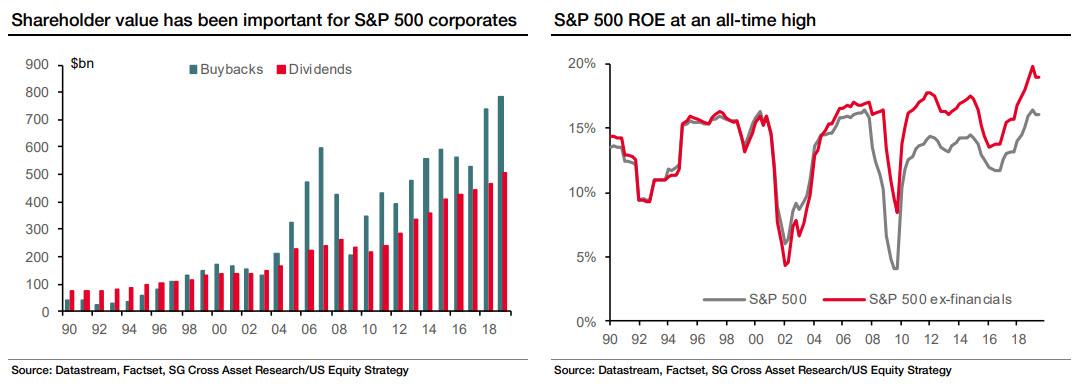
The answer, for those who have been reading our weekly observations on this big “conundrum”, is well-known. For everyone else, SocGen notes that Trump’s late-2017 Tax Cuts Tax Cuts and Jobs Act marked a shift and contributed massively to the wave of share repurchases over the past two years. The amounts steadily increased to a record high in 2Q19 – equivalent to a 3.2% buyback yield, which comes on top of a 2.2% dividend yield. Meanwhile, the S&P 500 return on equity is currently at an all-time-high.
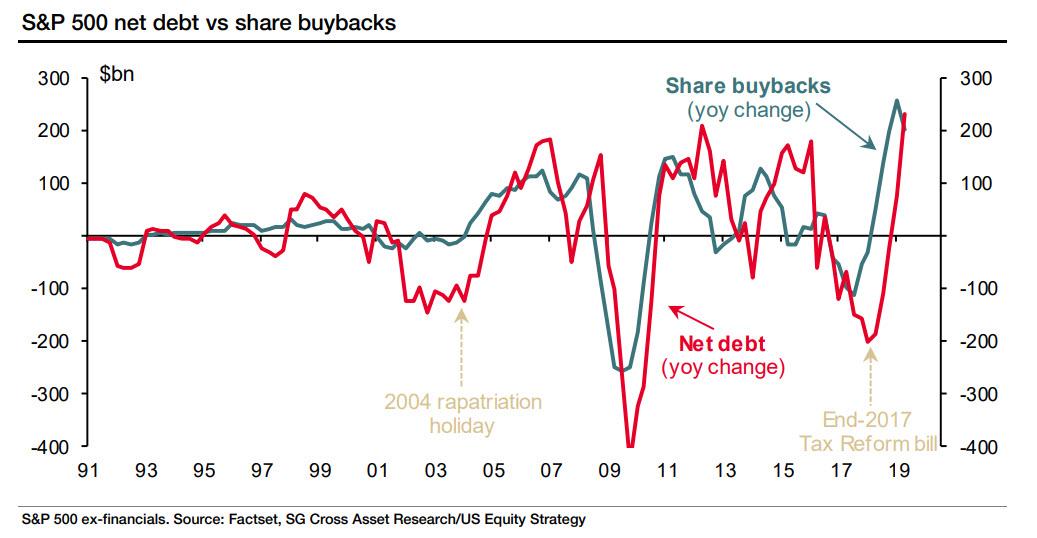
Here, it is also worth pointing out that the vast majority of these buybacks were funded by new debt issuance, most of it in the BBB bucket. Ironically, none other than former NY Fed president Bill Dudley was lamenting last week the “BBB-Bulge”, warning that trillions in fallen angles could soon flood the junk bond market.
They certainly can, and the irony is that the next bond crisis will be the result of massive issuance to fund buybacks, which in turn sent stocks to all time highs and boost management cash compensation to record levels. Needless to say, the reverse will not be pleasant for equities.
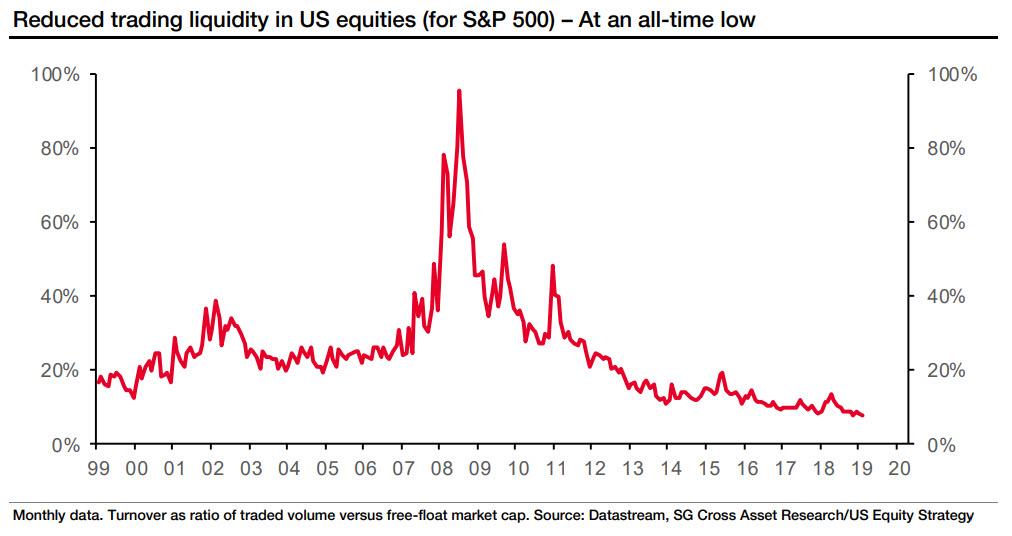
Besides ruinous central bank policies encouraging management teams to go out and issue record amounts of debt which they can then use to repurchase stock, there is another reason behind the year’s tremendous, if euphoria-less, ascent: “the lack of market liquidity, as measured by S&P 500 turnover – the ratio of trading volume vs free float market capitalization – has exacerbated the impact of share repurchases on US equities“, according to the French bank. Indeed, trading volume has been on a downtrend since 2008, and Socgen expect this to continue.
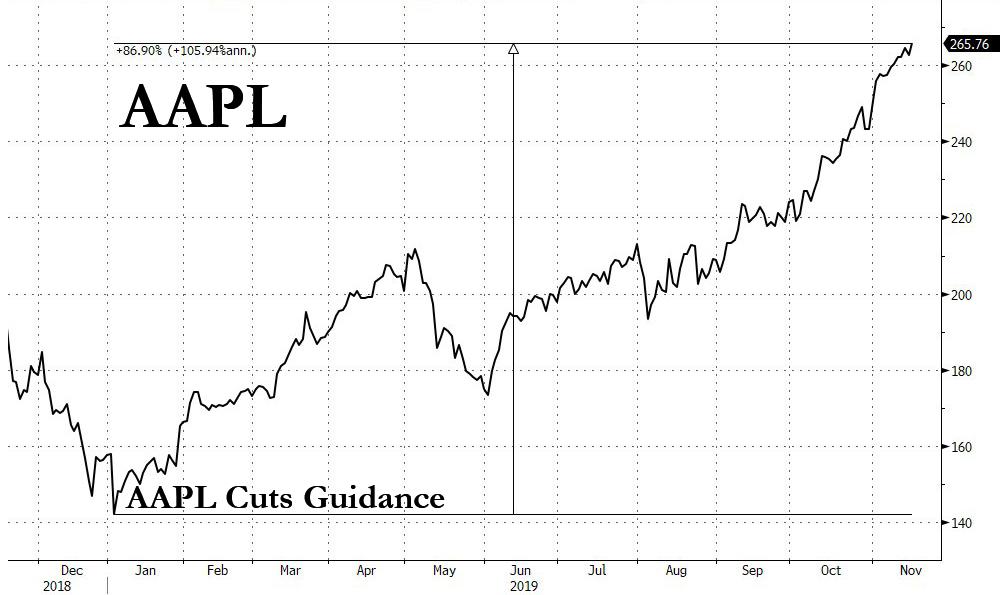
The implication is simple: one substantial buyback program, like say Apple’s latest $75 billion stock repurchase authorization, (after it bought back $100 billion in 2018) has an outsized impact not only on the price of AAPL stock, but the entire market too. That’s precisely what has happened in a year which started with AAPL cutting guidance, only to soar 86% since.
Meanwhile, a third of AAPL’s stock has been repurchased ever since Tim Cook decided to engage in financial engineering instead of actual engineering, for a company whose actual engineers have failed to come up with a new, engaging, must-have product ever since the death of Steve Jobs. Is it any wonder that the only thing keeping AAPL stocks up is… itself?

Putting these together, SocGen concludes that “share buybacks and a lack of trading volume have supported the S&P 500 at a time when the global recoupling of growth to the downside put global equities in a tough spot. However, we believe market participants in recent weeks have started to price in an alternative scenario.”
Which brings us to the forecast phase. Here, JPMorgan comes first with a rather simplistic assumption. The bank’s Greek quant proposes a similar deus ex explanation as the bank’s Croatian quant, and postulates that the same retail investors that pulled money out of the market for all of 2019 will make a thunderous return in 2020, and be the catalyst to push the S&P to new all time highs. This is what Nick Panigirtzoglou calls the “Great Rotation II“, modeled after a similar rotation out of bonds funds and into stocks in 2013. To wit:
If this view proves correct and the overall cyclical picture looks better over the coming months and quarters, retail investors are more likely to shift from a risk-off mode to a risk-on mode next year, by reversing this year’s equity fund selling and by reducing drastically this year’s extreme bond fund buying. Such a dramatic flow shift would be equivalent to another Great Rotation, i.e. a repeat of the abrupt shift away from retail investors accumulating bond funds to buying equity funds seen previously in 2013. In other words, 2020 would be the year of Great Rotation II, in a repeat of 2013 the year of Great Rotation I.
While on the surface, this thesis makes sense, Panigirtzoglou himself points out the weakest link: contrary to conventional wisdom, investors already have near record equity exposure:
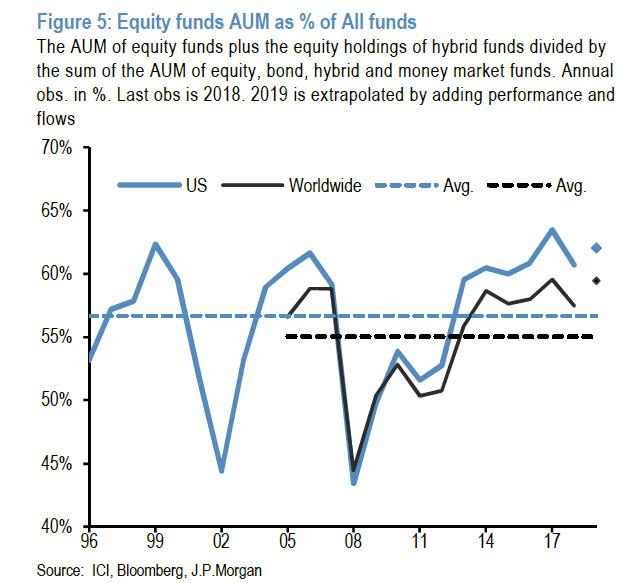
[Investors] equity fund share has exhibited some mean reversion since the mid-1990s. It had increased sharply over the five years to 2017 as a result of the equity rally, with most of the increase taking place during 2013 and during 2017. The metrics in Figure 5 declined sharply during the equity market correction of Q4 2018 but most of that decline reversed this year. This implies that retail investors are entering 2020 with only modestly lower equity position relative to the highs of Q3 of 2018 or end 2017. In addition, the current equity position is very close to the two previous equity market peaks of 2007 or 2000.
So for JPM’s Great Rotation II thesis to play out next year, retail investors would need to accept equity weightings that are even higher than the previous equity market peaks of 2007 or 2000.
If they do, this would represent a structural change in retail investors’ asset allocation, perhaps justified by structurally lower cash and bond yields vs. equity yields, compared to the previous 2007 and 2000 cycles.
Paraphrasing JPM in a slightly less politically correct way, there is an unprecedented need for institutions to dump their stock holdings on retail investors, and only a reversal in retail outflows can help push stocks to new all time highs in 2020. It would also explain why central banks have been so forceeful in stepping on the accelerator and either easing or launching “NOT QE”, as stocks threatened to anything but go straight up.
That is JPM’s take on 2020. What about SocGen’s?
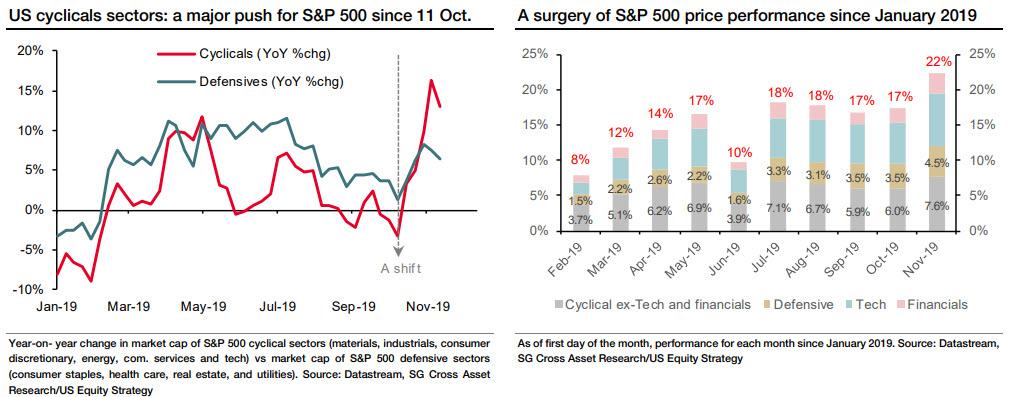
As the French bank explains, “last month’s announcement of a “Phase 1” agreement in US/China trade talks on 11 October by President Trump, 463 days after the trade dispute began, was a welcome relief in the financial markets, significantly lifting risky assets.” Sure enough, over the past month the S&P 500 reached an all-time high of 3,125, driven mostly by cyclical sectors. This marks a real shift in sentiment, as defensive sectors had been showing higher yoy growth in sector market cap in the S&P 500 over the year. On the other hand, as we noted last week, this reversal in sentiment appears to now be over and as markets once again price in an economic slowdown, the outperformance of cyclicals has faded sharply – with value stocks down 9 out of the past 11 days – and defensives are once again leading the market’s ascent.
Why is this important? Because as both Marko Kolanovic recently, as SocGen on Friday suggest, for the market to have material upside in 2020, it will be key for the leadership to shift from defensives to cyclicals, as the global economic outlook shifts to an optimistic one. Alas, that would also mean that bond yields would surge well above 2%, effectively planting the seeds of the market’s own destruction, because the higher yields rise, the more likely central banks will be to turn hawkish again, and so we would go back to a Q3 2018 scenario.
Incidentally, as we first wrote two weeks ago, and as Bloomberg finally picked up on Friday, not only is the recent bout of bond selling over, but so is the “great rotation” as we first dubbed it (well before JPMorgan).
Rotation aside, SocGen also points out that if one looks at the Conference Board US Leading Economic Index, the US has undergone three mini-cycles since the 2007 Great Financial Crisis (GFC).
SocGen also points out a close link “with the yoy performance of the S&P 500. More recently, while the US Leading Economic Index bottomed (+0.4% yoy), the S&P 500 seems to have started to factor in a fourth mini-cycle. What are the characteristics of a mini-cycle and how does this impact our view on US equities?”

