
Nordea stiller spørgsmålet, om vi risikerer en second lock-down, fordi der er indikationer af flere virus-tilfælde i USA. Men der hersker tvivl om det, bl.a. fordi flere bliver testet, og det giver flere virus-registreringer. Skulle en ny lock-down komme, vil det gøre ondt på investorerne, fordi ingen har regnet med det. Men et større problem er, hvordan balancen bliver mellem den ameriklanske likviditet og verdenshandelen.
FX weekly: Should we fear a second lock-down?
Even if the Fed tried to print the USD into smithereens during April and May, a rebound in world trade is needed to lastingly increase USD liquidity. World trade may rebound right when Fed slows printing, why the USD could be caught between stools.
Quote of the week:
“I told my people to slow down testing” Donald Trump in Tulsa
There will not be a second lock-down even if the case count continues to escalate in the US. That is the conclusion if you ask Trump (and our Twitter-followers), who even decided to gather a yuuge crowd in Tulsa yesterday. The “we had enough crowd” is increasing in size, it seems.
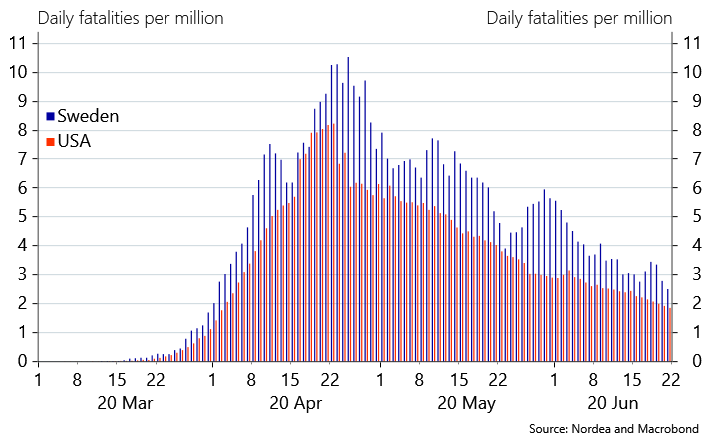
More and more people are tested every week on a global scale, why we generally struggle to understand all the fuzz about the increase in the Covid 19 case count. If you test more, you find more cases, right? If we are to see a lagged and material spike in hospitalizations (some early signs present) and fatalities we likely need to care again, but for now we remain fairly calm. It is not as if we salute the handling of the virus in e.g. US and Sweden, but even with wobbly Covid-19 policies, it seems as if the virus has lost momentum judging from a 7-day average of fatalities per capita in both of those countries.
Chart 1: Even with a wobbly handling of the Covid-19 crisis, both Sweden and the US are seeing a slowing fatality rate (a running 7-day average of fatalities per million in the chart)
A second lock-down, in case it becomes a reality during H2-2020, would hence most likely wrongfoot investors again. Equities lower, credit spreads wider, USD stronger and long core bond yields even lower and so on.
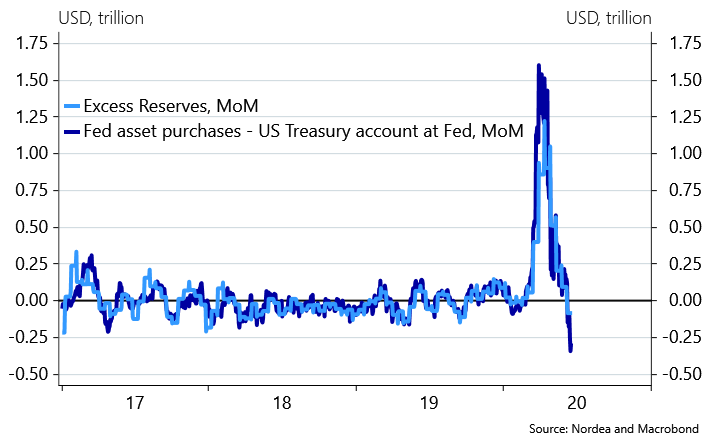
It has been a hot topic on FinTwit and elsewhere whether the Fed has printed enough Dollars to send the USD into a bear-market spiral. The increase of digital USDs in circulation in the commercial system was nothing but bizarre in March and April but the USD creation from Fed has slowed markedly already. USD liquidity has tightened as USD swaps rolling off foreign CBs balance sheets paired with a build-up of the cash-buffer has removed USDs from the system but Mnuchin holds a potential USD liquidity bazooka, if he and the US Treasury decide to bring down the TGA (currently at levels above USD 1500bn). The latest running monthly development is a USD 300bn withdrawal of liquidity, which is a gamechanger compared to the bizarre excess liquidity regime that ruled through March, April and May.
Chart 2: USD liquidity is now officially shrinking FAST
USD liquidity will likely remain tight from a momentum perspective unless Mnuchin unleashes his liquidity-zooka during H2-2020. With 600bn of planned in issuance in Q3, the Fed will continue to fall short of “buying it all”, which could lead to less benign USD funding conditions compared to recent weeks.
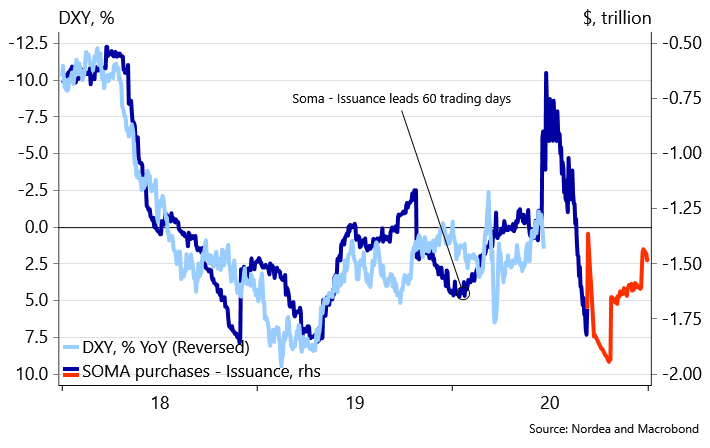
Usually the USD only weakens if the Fed comes close to “out-printing” the US Treasury. Currently Mnuchin and the US Treasury “out-issues” the Fed, which rather speaks in favor of a strong USD development during H2-2020 as USD liquidity leads the DXY index by around 60 days. It would be senseless to continue the bizarre debt frontloading during H2-2020, why the updated quarterly refunding plan 5th of August could include a MATERIAL downwards revision of the net issuance target, which in turn will lead to a more benign USD liquidity environment again.
Chart 3: If the Fed wants to weaken the USD materially, they probably need to print some more…
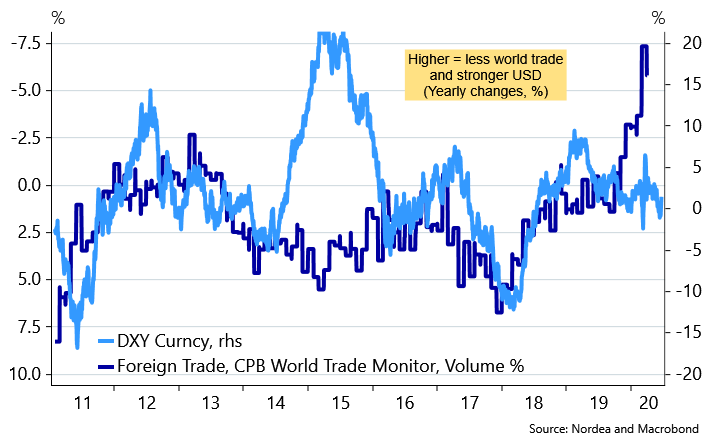
While the Fed is the direct source of USD liquidity (or digital reserves), world trade is the main source of USD liquidity velocity. When world trade flows freely and increases in volume, it usually leads to a weakening of the USD, while the opposite is the case when world trade slows. The running trade deficit of the US is a material source of USD liquidity for foreigners, why USD liquidity becomes scarce abroad when trade flows are subdued. This is the exact reason why the USD always gains during a US recession as the lack of imports lead USD liquidity to dry out outside of the US.
The USD was caught between a red-hot printing press (USD negative) and a material setback for world trade flows (USD positive) during April and May. Right when the Fed printing press is starting to run less hot, world trade flows are also showing signs of a rebound, which could lead to a renewed caught between stools scenario for the USD.
If i) the Fed keeps the printing press running, ii) Mnuchin reduces the issuance pace as too much debt has been frontloaded (the US Treasury could just decide to bring down the TGA) and iii) world trade rebounds markedly, then we have the perfect USD weakening cocktail in place. For now, only assumption i) holds fully true.
Chart 4: When world trade slows USD gains and vice versa
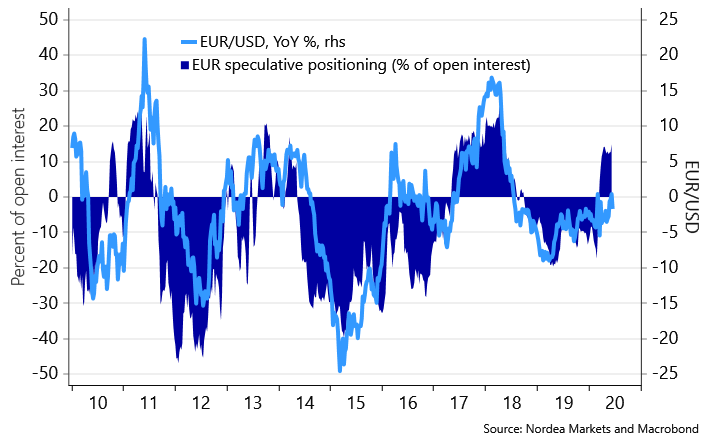
The market is slightly positioned for USD weakening but in contrast to most commentators we don’t find the positioning particularly heavy. The market is net 10% long EUR vs. USD taken as % of open interest, why much more extreme EUR bullishness (USD bearishness) was e.g. seen in 2017 and in 2011 ahead of the debt crisis. One could argue that the EUR performance has been weirdly subdued despite a market moving from a net short position to a net long position, but it likely has to do with the US recession as mentioned above. We still find good risk/reward value in a long EUR/USD position.
Chart 5: Long EUR/USD positioning is still fairly light
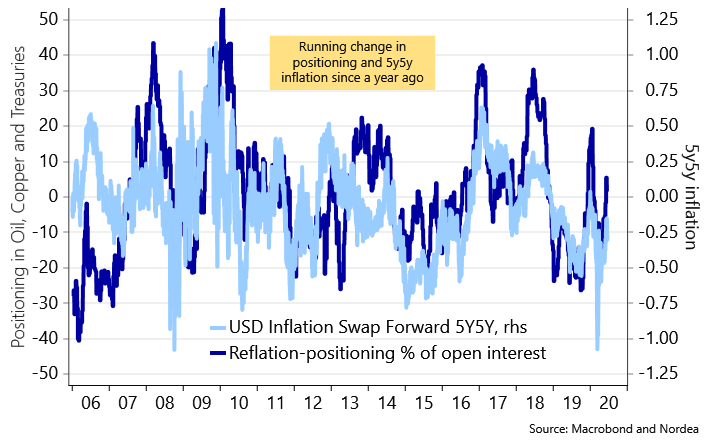
The market has also slowly started to reposition for a reflationary story which is in line with the positioning for a weaker USD. Our reflationary positioning tracker (commodity / rates) has been moving up since early May, but we remain very far from the overloaded reflationary positioning from late Q4-19 / early Q1-20. Positioning is yet to be worrisome and it means that the pain trade is still higher in equities and credits, while steepeners (e.g. 3s30s in USD swaps) could have a further potential to perform in particular if the Fed implements a light YCC in September. Even if actual core inflation falls of a cliff (as it likely will), we would argue that inflation swaps are a big “pay”.
Chart 6: Reflation positioning is now net long again.. Time for inflation swaps to follow suit?
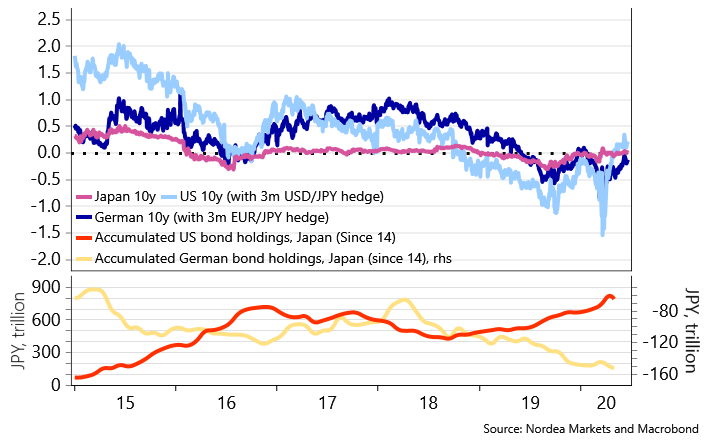
10s30s will likely also continue steepening as the Japanese investors now hold an incentive to buy FX hedged 7-10yr Treasuries again as long as the Fed is not thinking about thinking about raising rates, while the BoJ keeps the 10yr point at “0%”. It is hard to imagine a material increase in 10yr bond yields, if any increase at all, due to that exact metric. If the Fed introduces a light YCC with a yield cap on 3-5yr yields, it should also indirectly work to semi-cap the 10yr point.
Chart 7: Japanese investors hold every incentive to buy 7-10yr USD bonds again
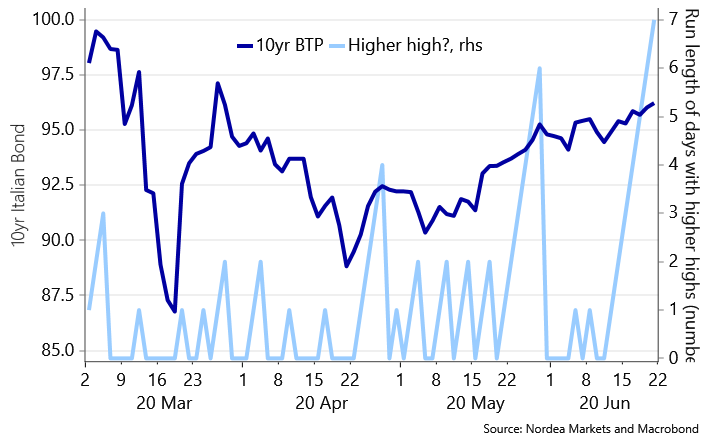
Italian fixed income has probably been THE best bet in bond space in recent months. The current 10yr bond (10/17/2029) has traded up seven days in a row, which is a new record for that bond. It also goes to show that Italian bond yields drop both on days of risk off and risk on. The PEPP beast is probably too big to fight, also even if we ultimately get a watered-down version of the current suggested “Next Generation EU” debt deal. When Italian bonds perform, it removes a fair bit of deadweight tonnage from the EUR, why all the ECB money printing could prove to be a net EUR positive short-term.
Chart 8: 7 days of higher/highs in the current 10yr Italian bond.
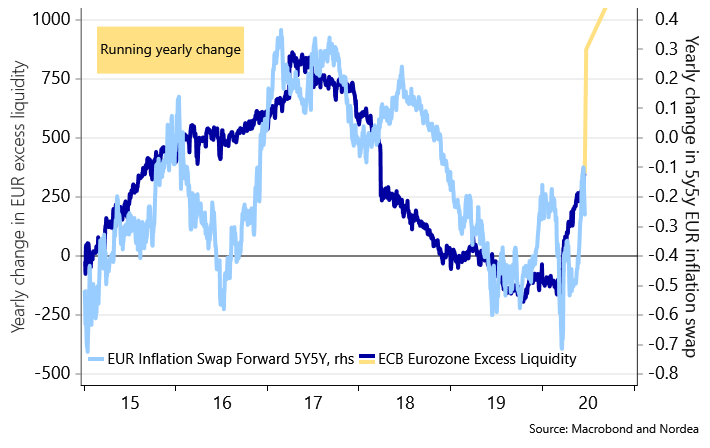
A net liquidity addition of EUR 548bn will arrive 24th of June (due to the EUR 1308bn uptake in the TLTRO) and if former patterns are to be trusted, it could prove to be a positive game-changer for EUR inflation swaps as well. Mo printing, mo artificial inflation expectations!
Ultimately, more EUR printing encourages increased indebtedness, which is NOT a positive inflation story down the road, but that is not a story for 2020.
Chart 9: Mo printing, mo artificial inflation expectations.
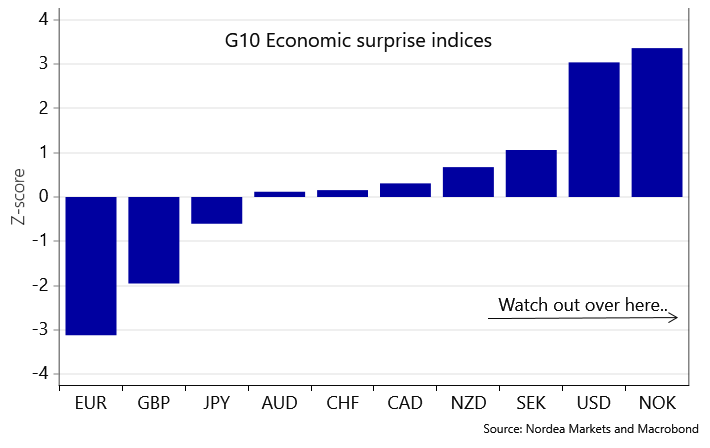
Interestingly, the EUR macro surprise index remains very depressed despite the V-shaped diffusion index shenanigans seen across G10. The Euro PMIs are out this week, and they hold a fairly decent chance of surprising on the topside, since the median economist apparently doesn’t understand the “diffusion index mean reversion disease”.
Load up on long EUR/USD risk!
It may on the other hand be worthwhile removing a few chips from the long NOK/SEK bet, since the Norwegian surprise index is SUPER elevated.
Chart 10: EUR surprise index is the worst in G10. Time for mean reversion?
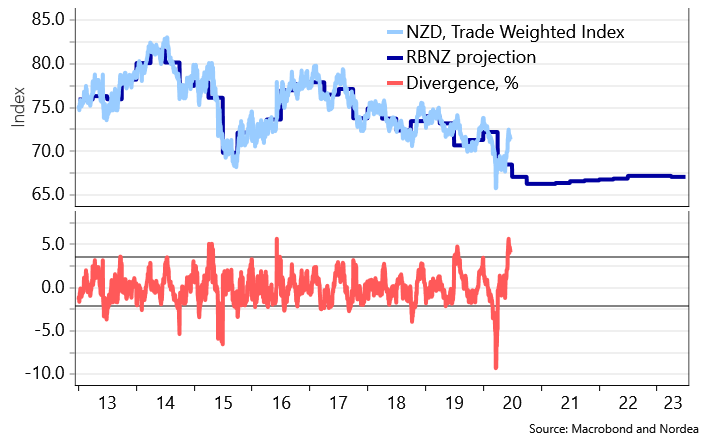
We are on Kiwi-watch as well as the RBNZ’s meeting on Wednesday could oddly enough prove to be of global interest since it is the central bank that is the “closest” to implementing NIRP. Both the Fed and the BoE have put a lid on the NIRP story in USD and GBP, but if the RBNZ moves closer to finally implementing negative interest rates, it may be that the NIRP betters returns with a vengeance. The NZD is now almost 5% stronger than when the latest RBNZ projection was launched. The positive aspects of the NIRPening are debatable, but it works if you want to kill your currency. How strong an NZD can the RBNZ accept?
Chart 11: NZD is too strong. Will we get closer to the NIRPening in Kiwi-land?
Scandi markets: Norway is now more “open” than Sweden
The authors of this piece have been skeptical around the Swedish corona strategy throughout, and we highlighted the possibility of Sweden being “stuck” with the current policy for much longer than peers since herd immunity is practically impossible to obtain.
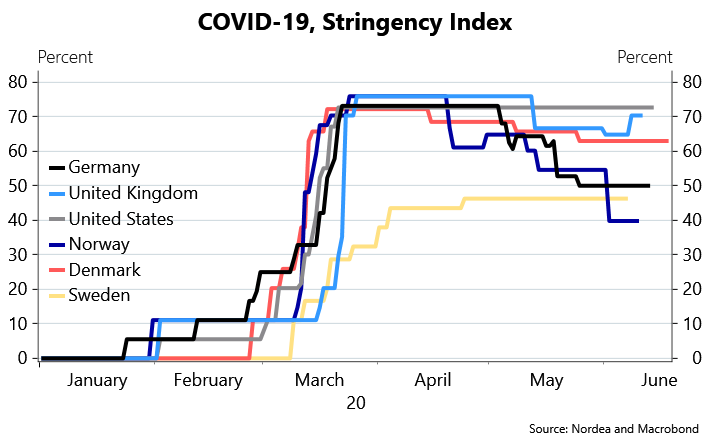
This has now come into fruition as Norway is more open than Sweden on the Covid-19 policy stringency index. When will an international newspaper write a positive story on the Norwegian corona strategy? This is a reason to expect Norway and NOK to continue to be a better high beta bet than Sweden and SEK. Norway has a reopening momentum, while Sweden is stuck with the current strategy.
Chart 12: Norway is now officially more open than Sweden
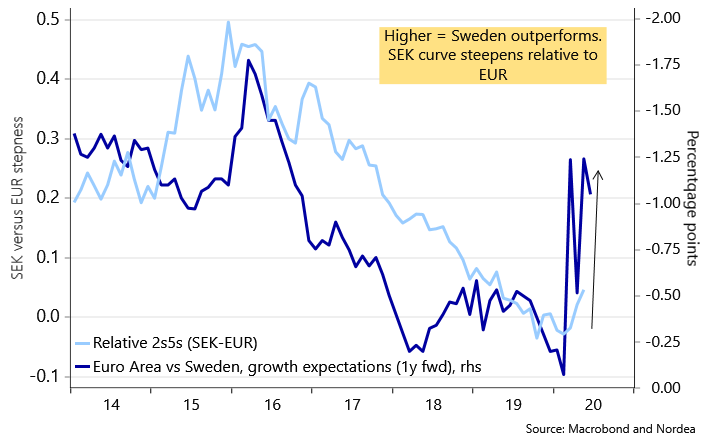
It still seems to us that the Swedish steepener case could have more room to go despite the lack of a re-opening momentum. I) SEK is getting a tad too strong to the Riksbanks taste as it is more than 3% stronger than anticipated in the February KIX forecast, ii) SGBs remain unattractive from an FX hedged perspective, iii) Swedish hard data will look decently OK compared to Euro area hard data, iiii) The Riksbank may be tempted to cut in to a global rebound if SEK gets too strong and v) Issuance targets will likely be taken down during H2 as too much has been prefunded. The issuance story could also fuel a decent steepener narrative as it is a sign that corporates are in better shape than feared. This leaves a decent scope for steeper 2s5s vs. EUR, and probably also an OK scope for SEK vs. EUR but we continue to prefer NOK as the better high beta bet.
Chart 13: A steepener catch-up to come in Sweden?
NOK: Don’t blame salmon
It turns out that Norwegian salmon wasn’t the reason behind the corona outbreak in Beijing after all. Still, reputational damage might have been done which could prompt lower demand and lower salmon prices. We are getting some concerned questions on whether this could hurt the NOK so let us spend some lines on why you should completely ignore salmon prices as a NOK driver.
First, correlation isn’t very strong. And when it is, it often comes on the back of oil prices moving the same way, like we have seen through the corona crisis. Oil price correlation is stable and always has the “right” sign (except for a special situation in 2017) while salmon price correlation really doesn’t tell us anything.
Chart 14: Correlation to salmon price is all over the place
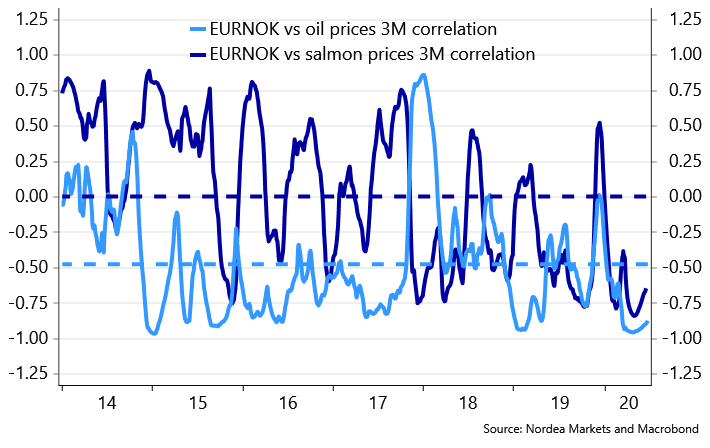
Secondly, the sector is not particularly important in a macroeconomic context. The salmon sector is very capital intensive and as a share of total employment it is close to insignificant (in macro that is). A survey from 2016 shows that about 7 000 was employed in the salmon industry, which adds up to 0.2% of overall employment. The incomes from salmon export end up in the hands of some local heroes and may therefore have impact on the local community, but again it’s really the macro picture that matters.
Therefore, we continue to watch oil prices and the overall risk sentiment. Oil prices have rallied and supported the NOK. However, we question how much further they can go but we save that discussion for another Weekly.
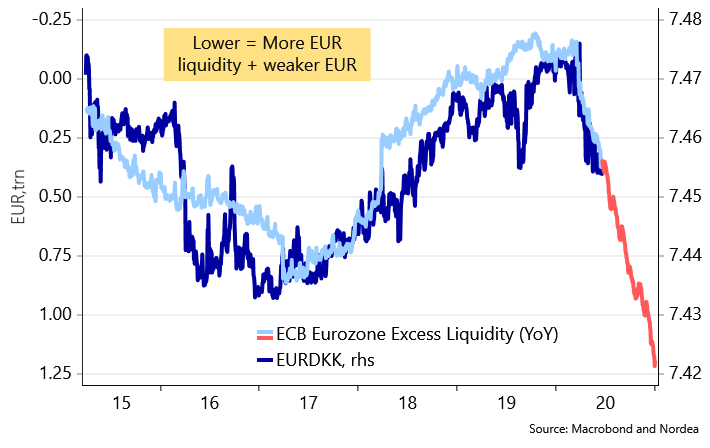
DKK: JUST buy it!
Finally, we want to briefly touch upon the DKK. When the ECB prints a massive number of EURs (EUR 1250-1500 bn increase likely this year), it must lead EUR/DKK lower unless the Danish central banks “mirrors” the increase in the EUR monetary base. The Danish central bank is 100% reactive due to the managed EUR/DKK peg, which means that the market will have to force its hands. The only way the market can call the Danish central bank to action is via EUR/DKK spot. The below chart even suggests that EUR/DKK will be forced below 7.4330, which has been the most recent DKK selling intervention threshold from Nationalbanken.
We have more on the strong DKK case here.
Chart 15: More EURs around -> EUR/DKK trades lower..
Our running track-record is always attached here.