Uddrag fra Zerohedge:
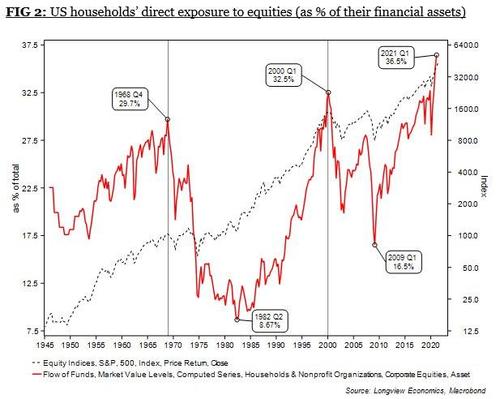
“The public buys the most at the top and least at the bottom.”
The graph below from Longview Economics speaks volumes for where the equity markets are in the investment cycle based on Bob’s logic.
And what could trigger that? Nomura’s Charlie McElligott is nervous about the imminent options expiration and the concommitant ‘gamma unclench’…
The upcoming quarterly Index / ETF options expiration next week is set to be a whopper, because nearly 70% of the S&P options Delta and Gamma is front-month for the serial Op-Ex…which, despite the aforementioned modest pullback from ATHs, remains “mongo” (in particular SPX / SPY $Delta at 96.3%ile, QQQ $Delta 96.5%ile).
But the risk then is that you “unclench” after that (VIX Wed, Index / ETF / Singles Fri) as has been the case around the market finally “getting” the options expiration cycle now (see chart below, where clients now try to get ahead of this Dealer-driven flow and begin to de-risk into said “window for pullback), where any expansion of vol around this technical thereafter could see the current “really stuffed” Systematic Vol Control exposure then de-allocate from its recent “grab” (+$124.5B over the past 6m, 93.0%ile and set to buy even more over the next week, as highlighted above)…and especially with so much potential de-risking flow from the aforementioned “extreme” $Delta in index / ETF options.
While from a macro-perspective, that same “window for a pullback” time-frame houses the commencement of the “buyback blackout” for Banks / Financials into start of EPS season…and critically, has proximity to the Fed meeting the following week, which could act to limit “short vol” flow muscle-memory due to the event risk (i.e. the potential for a larger than expected adjustment to the SEP / future ‘dot’ path)
Specifically pointing to the 4400 level for S&P as critical support…
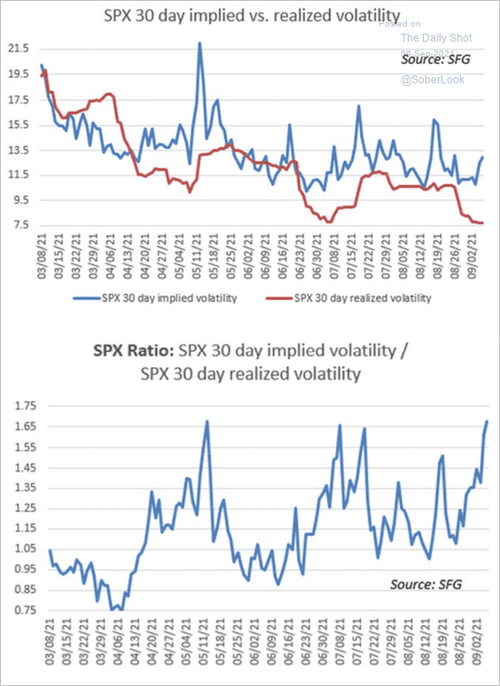
And while VIX may appear (optically) low, it is still extremely elevated relative to historical vol, signifying anxiety is far higher than it appears on the surface. As RealInvestmentAdvice.com notes, the S&P 500 realized and implied volatility measures continue to diverge suggesting not all is as well as it seems.
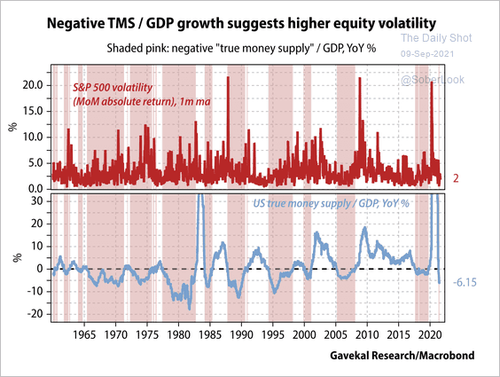
With the amount of liquidity in the system declining, there is a rising probability of a pickup in volatility.


