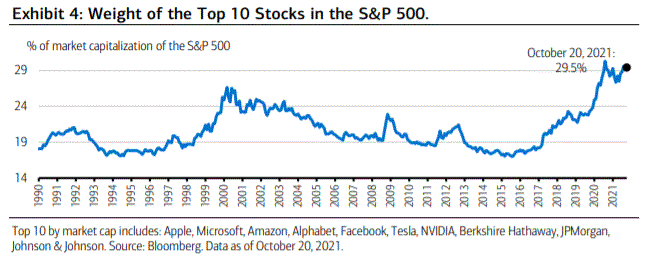
Merrill har set nærmere på de store tech-selskabers dominans i S&P 500-indekset. Giver de et forvredet billede af indekset og dermed af markedet? Er der en risiko med denne koncentration, især med øget inflation, strid mellem Kina og USA og energikrisen? De 10 største selskaber i indekset står for 29,5 pct. af indekets værdi. De fem største står for 22,4 pct., og alene Apple og Microsoft står for 12 pct. af værdien. Da indekset er så stærkt præget af ganske få selskaber, som alle er teknologitunge, udgør det så en risiko? Nej, siger Merrill. Markedet er helt anderledes end under dotcom-krisen, for dengang tjente de mest værdifulde selskaber ikke ret meget. Men det gør de største selskaber i dag. De ti største tjente 28,1 pct. af S&P 500-selskabernes indtjening det seneste år – og det svarer til andelen i indekset.
The Market Concentration of the S&P 500: How Much of a Concern
for Investors?
Our investment base case is that the main U.S. indexes will continue to grind higher over
the medium term, supported chiefly by a reacceleration in U.S./global economic activity
and productivity-led earnings growth. That said, and not unexpectedly, there are risks to
our outlook, including a sustained rise in prices/inflation, a U.S.-China geopolitical shock,
and an unexpected global energy crunch, among others. And yet another potential risk—
market concentration—as depicted in Exhibit 4.

While 505 constituents make up the S&P 500, the 10 largest companies currently account
for 29.5% of the index’s total weight. The Pareto Principle applies here, with a small
number of stocks responsible for a disproportionate concentration in market capitalization.
To this point, the top five largest constituents (Apple, Microsoft, Amazon, Alphabet and
Facebook) now account for 22.4% of the index, while just two companies—Apple and
Microsoft—represent 12% of the index.
Given the top-heavy, tech-led nature of the S&P 500, is it time to worry? We believe the
short answer is no.
Yes, the market cap of the S&P 500 is geared toward the top 10 stocks in the index. But
so are S&P earnings. According to data from Standard & Poor’s, the earnings contribution
of the top 10 firms in the S&P 500 at the end of September 2021 was 28.2% (based on
last 12 months’ earnings), roughly in line with the top 10’s index weight.
Dare we say it’s
different this time; that unlike the lead up to the dotcom meltdown, when mega-valuations
were supported by minuscule earnings, today’s market caps are underpinned by outsized
earnings and the fact that the top 10 firms in the S&P are amongst the most profitable
and competitive in the world. Against this backdrop, the highlight of Q3 earnings season is
upon us with the S&P’s top five firms reporting earnings this week.


