At the end of January, I discussed the potential for a reflexive rally in the markets and laid out three retracement levels at that time.
“The good news, if you want to call it that, is that the market is currently holding above the recent lows as short-term oversold conditions once again approach. It is critically important that the market holds above that support, which is also the neckline of the current “head and shoulders” formation, as a break would lead to a more substantive decline.”
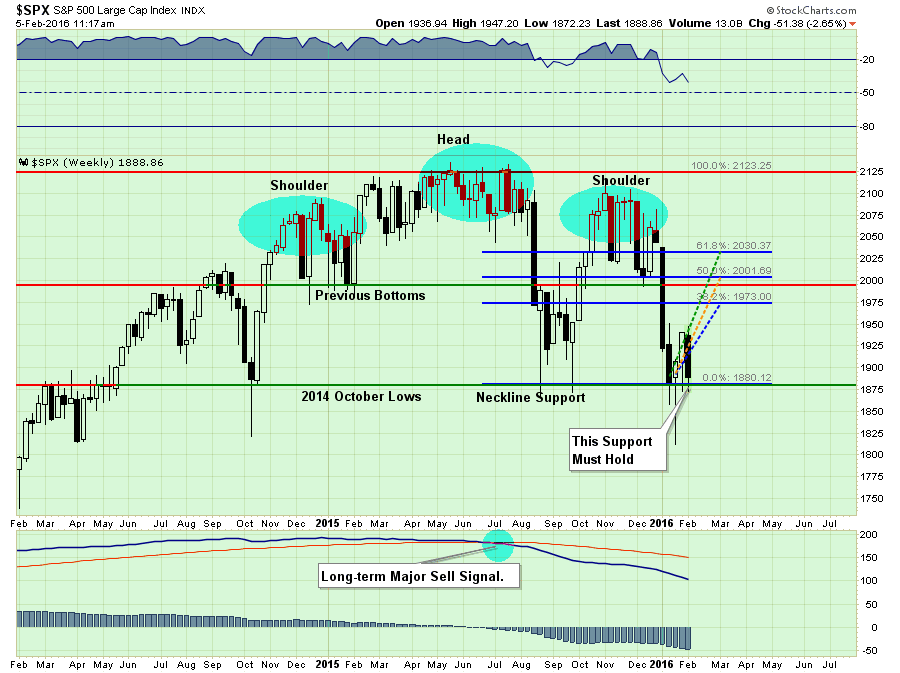
Here is the same chart updated through Friday’s close:
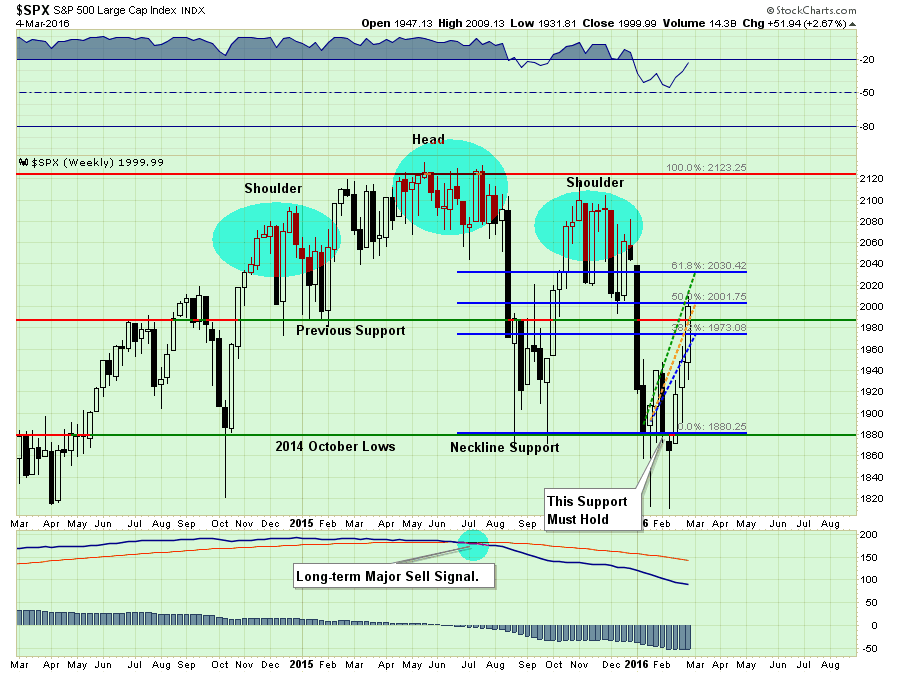
I pointed out last week that:
“The good news is that the market was able to break above 1940, and the 50-dma, which now clears the way for a push to the 1970-1990 where the next levels of resistance will be found.“
The markets were not only able to push into the 1970-1990 level last week but also complete a 50% retracement from the recent lows as shown above. The 8% advance from the closing lows just 4-weeks ago has sent “shorts” scrambling to cover pushing stock prices sharply higher.
But does this change any of the recent analysis?
I’M MISSING IT
“OMG!!! I am missing it. Don’t we need to be jumping back in?”
It is not surprising that the recent surge in the markets has awakened the “bullish spirits.” However, that is an emotionally based response to short-term market volatility rather than a decision to increase equity risk based on a defined and disciplined approach.
This goes to the heart of the portfolio management discipline and philosophy. The chart below shows the model allocation changes since 2013.
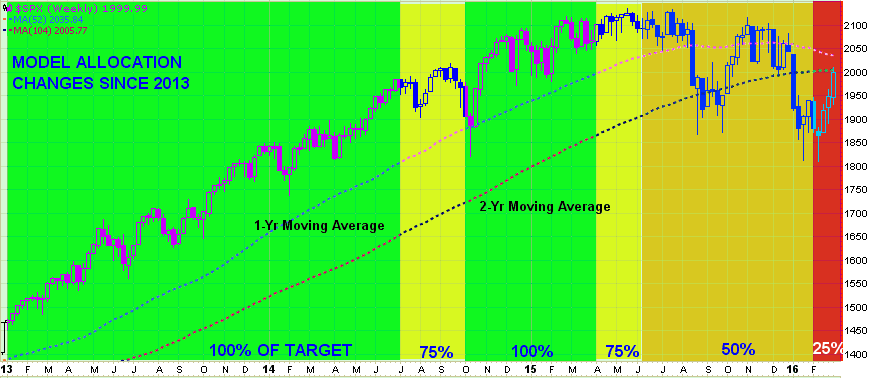
As you will note, portfolios have been grossly underweight equity related exposure since April of 2015 creating a positive performance gap between the index and the portfolio. That positive performance gap allows for a more relaxed approached to increasing portfolio allocations when the market re-establishes a positive price trend without sacrificing long-term performance.
The final reduction at the end of January protected portfolios from the decline in February, but has led to a minor performance drag over the last two weeks. But given that risk is still prevalent to the downside, I am willing to give up a potential “bear market rally” for the sake of protecting client capital from loss.
As I have stated before, when the market re-establishes a positive trend, I will recommend putting preserved capital back to work. However, for such an equity increase to be warranted, the market will need to break the current declining price trend and work off some of the currently extreme overbought conditions. This is shown in the updated chart from last week.
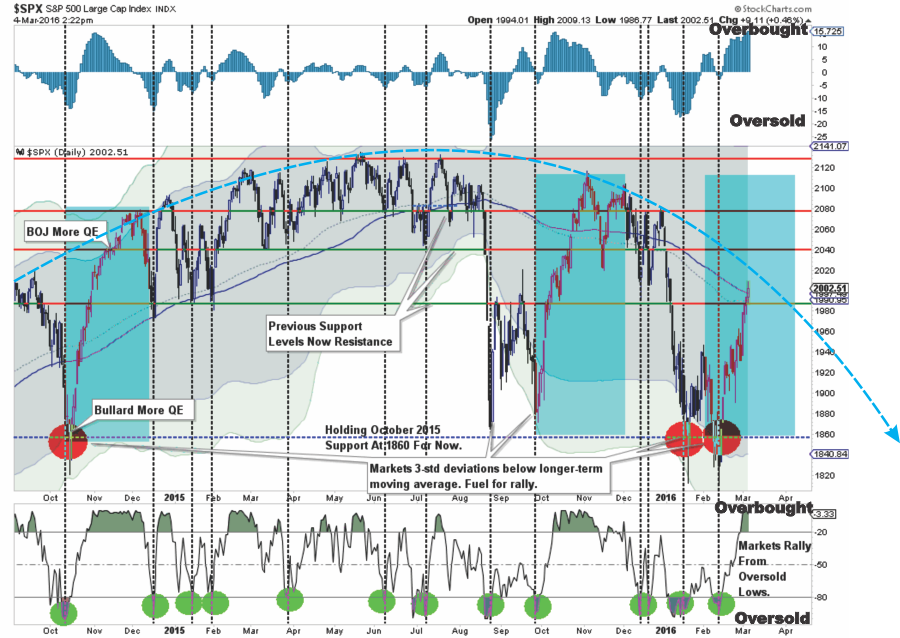
There are quite a few moving pieces here, so let me explain.
- The shaded areas represent 2 and 3-standard deviations of price movement from the 125-day moving average. I am using a longer-term moving average here to represent more extreme price extensions of the index. The last 4-times prices were 3-standard deviations below the moving average, the subsequent rallies were very sharp as short positions were forced to cover. The vertical blue bars show the previous two periods where bulls regained footing and pushed markets from lows towards new highs. The current setup is indeed similar to those previous two attempts.
- The top and bottom of the chart show the overbought/sold conditions of the market. The vertical dashed lines show that oversold conditions lead to fairly sharp rallies. The recent rally has responded as expected from recent oversold conditions. With the oversold condition now exhausted, the potential for further upside has been greatly reduced.
- With the 125-day moving average trading below the 150-dma, and with both averages declining rather than advancing, the easiest path for prices continues to be lower as downward resistance continues to be built. The arching dashed red line shows the change of overall advancing to now declining price trends.
The last sentence above is the most important. The signal to increase equity related exposure in portfolios will require a breakout above the currently negative price trend. Until that happens, we remain confined in a “bear” market.
TIME TO BUY OIL/ENERGY?
The short answer is “NO.”
Let me explain.
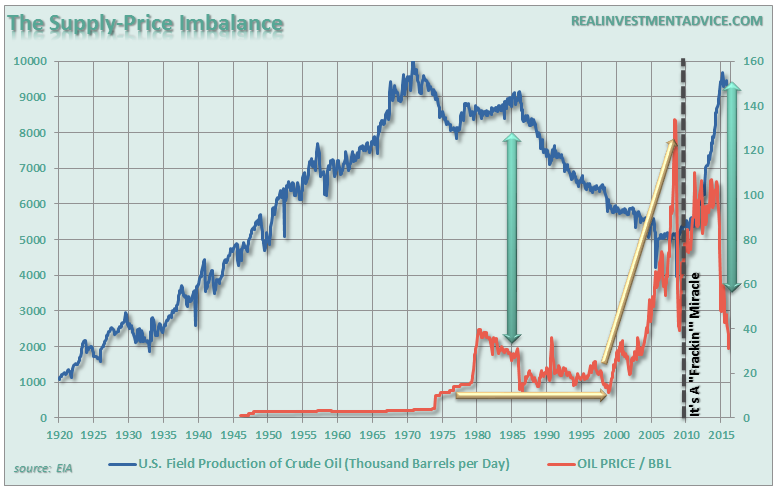
First, the rally in “oil prices” is a short-covering/extreme oversold move. While it “seems” like it has been a massive surge in the short term, as shown in the chart below, it barely registers on a longer-term basis. It is always important to keep some perspective.
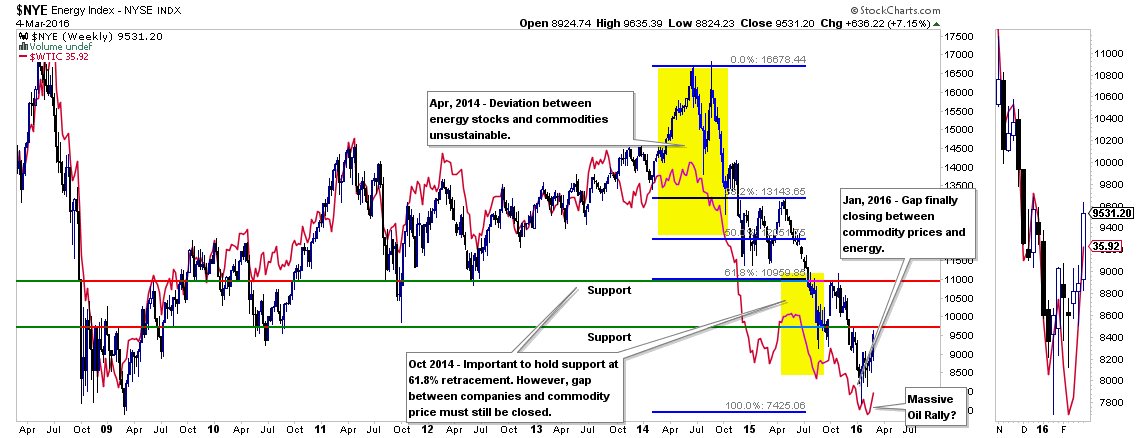
The chart notes the dates of some of the calls I have been making in this missive since April 2014 when I recommended getting out of oil/energy entirely.
Notice that prior to 2014, the correlation between oil and energy prices was extremely correlated. The deviation I noted in 2014 is now in the process of being corrected, but is not complete as of yet.
The decline in oil is not complete as of yet as there has been little progress in reverting the supply/demand imbalance. This will take several years to rectify and oil/energy prices will eventually settle into a trading range at these lower levels.
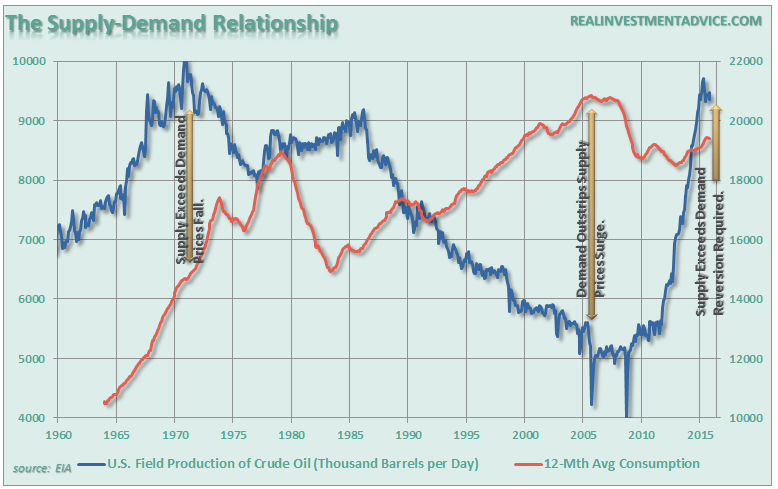
Again, for the sake of perspective, here is what happened to oil prices the last time supply and demand were this imbalanced.
As UBS recently explained:
“Yesterday oil ended in the green despite a very large reported crude inventory build, a reflection of how biased to the downside sentiment and positioning already is. Today, crude started in the red and has been mixed from there but moving higher. And both days, the stocks have led with energy the best performing sub-sector in the S&P.
Now, there is no doubt that the performance recently is TOTALLY short-squeeze led. Though it also shows how negative sentiment and positioning is.
WHAT HAS HELPED FUEL THIS SHORT SQUEEZE?
- Positioning and sentiment very biased to the short side/ underweight. And as we move up, the move is also exacerbated by short gamma positions that have to cover at higher levels.
- Despite high oil inventories (and still building), most upstream producers (from Exxon on down) have guided to lower than expected production as a result of lower CapEx.
- Ongoing hopes of a potential agreement between OPEC and non-OPEC members (seems unlikely but now a meeting set for March 20th is reviving some market hopes).
- Credit players covering equity shorts — evident today that “good credit names” are under-performing and “bad credit names” outperforming.“
As shown in the chart below, the number of outstanding contracts on oil is still well above the long-term mean suggesting that more unwinding needs to occur before a longer-term bottom in oil prices is made.
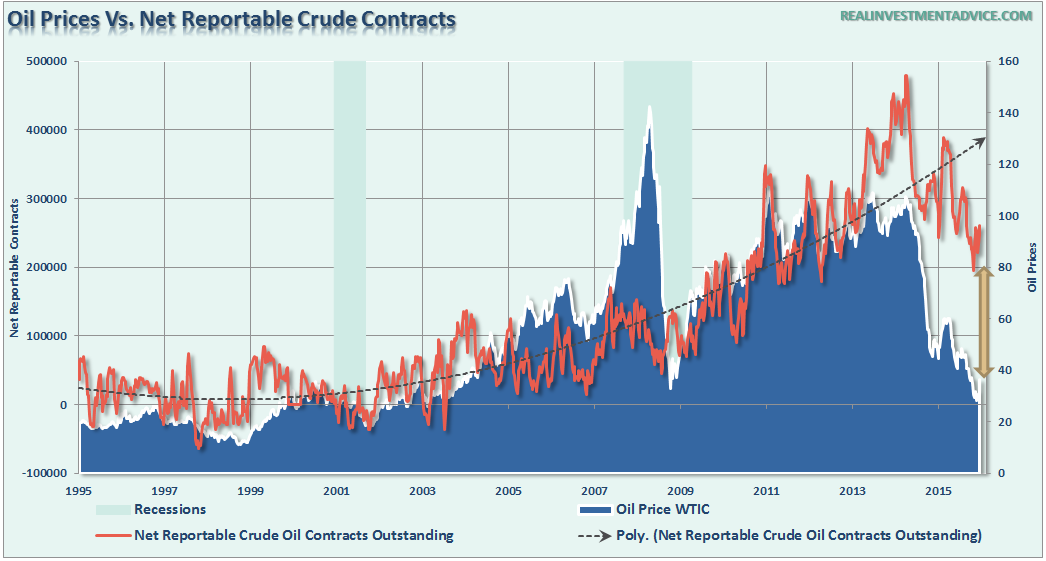
With energy-related stock prices once again at extremes, the next most probable move will be to the downside. This is particularly the case given the recent builds in inventories and a likely disappointment from OPEC/Saudi Arabia on March 20th.

Furthermore, the damage to energy company earnings will be accelerated as the last of hedges begin to roll off over the next couple of months. This realization will push energy stock prices lower as companies are re-evaluated for much lower profit margins and rising bankruptcy risk.
More layoffs are expected. As this occurs the negative impact to the Houston real estate market accelerate as homes fail to sell, apartment inventories rise and commercial buildings remain empty. But such will not be just a localized event but as further reductions in CapEx occur the ripple effect to the rest of the economy will grow.
Note: If you don’t think housing is about to become a problem, again, this piece by Aaron Layman should give you a wake-up call as interest only mortgages are back.
As Art Berman correctly stated in a recent interview:
“People think that the economy runs on money, but it runs on energy.”
He also details in the interview how the current oil price collapse represents devaluation from over-investment in unconventional oil – and most commodities – because of cheap capital, and is simply a classic bubble.
“Continued oil prices of $30 per barrel or less are the only reasonable path to higher growth and a balanced oil market. I think we’re gonna get to $16.50/bbl. Normal is over, and there is no new normal yet.”
It is well worth listening to if you think we have reached a bottom in oil/energy prices.
LOOKS LIKE A COUNTER-TREND RALLY
Eric Bush at Gavekal Research confirmed much of my own analysis on Friday suggesting that the current rally still has all of the earmarks of a bearish counter trend rally. To wit:
“The stocks with the lowest correlation to the dollar (and highest correlation to the yen and euro) have been the best performers over the past month. Today, we have come across another group of stocks that have been on a nice run that we think syncs up well with our analysis from yesterday and adds an additional signal that we are most likely in the midst of a counter-trend rally.
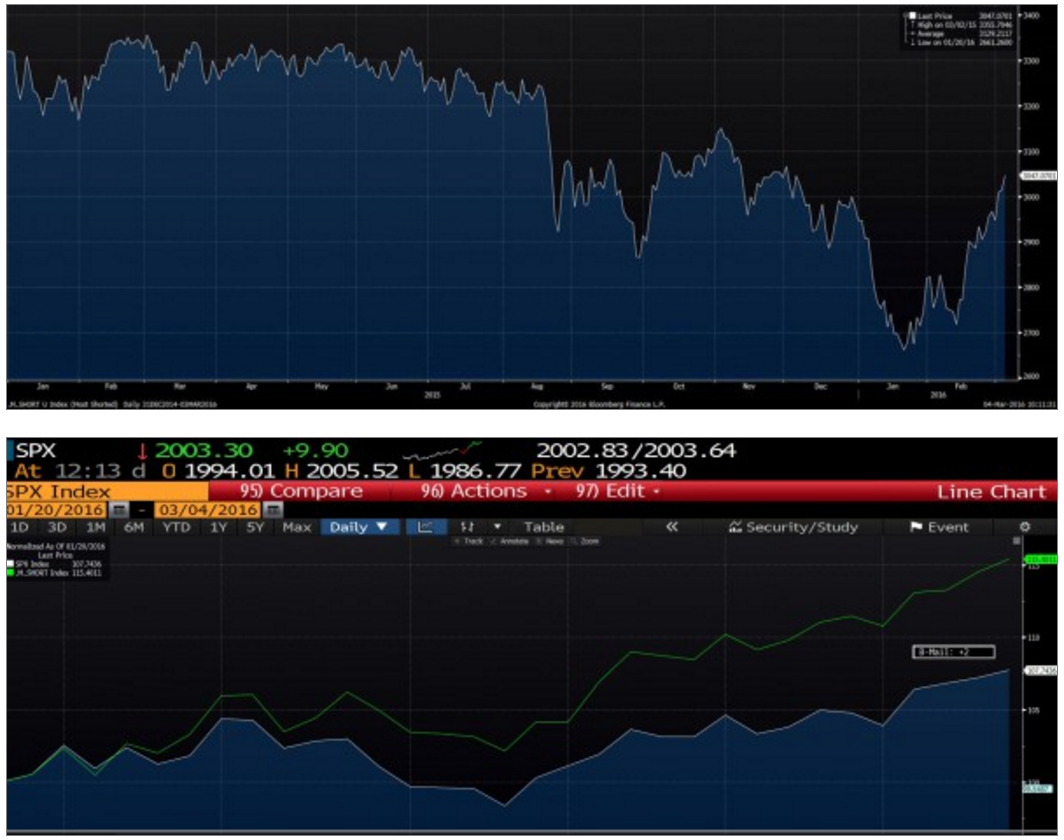
Late cyclical stocks tend to have a negative correlation to a stronger dollar. Consequently, given what we saw yesterday in our factor analysis we are not surprised that the two best performing industry groups over the past month in the developed world have been energy (12.1%) and materials (8%). These two industries have also been the worst performing (energy is down 27.8%) and the fourth worst performing (materials is down 14.1%) industry groups over the past year. Whenever the worst performing stocks start to outperform in the short-term, it starts to smell like a short covering rally. So it make senses that the most shorted stocks have also strongly outperformed the market over the past 4-6 weeks. In the first chart, we show a price series of the 50 most shorted stocks in the S&P 500. These stocks have had a nice V-shaped bounce and are at the highest level they have been at since early December. In the second chart, we show the performance of these 50 stocks compared to the S&P 500. Since January 20th, the most shorted stocks are over 15% higher while the S&P 500 has risen by a little less than 8%.”
“Given that we still haven’t seen a big enough expansion in 20-day new highs and that the best performing stocks over the past month, or so, have been those that have been beaten down the most over the previous year (and have had the most short interest), we believe we are in the midst of a counter-trend rally.
At this moment, the probability of more downside in the near term is probably greater than the probability that we have entered a new bullish phase.”
Eric is absolutely correct in his assessment. It is completely understandable that after sectors like energy, materials and industrials have had big declines that trying to bet on a bottom is enticing.However, that is the equivalent to “gambling without looking at your cards.”
As I stated, since we have been underweight equity risk since last year, there is no need to try and “guess” if the markets have finally bottomed. We only need to wait for the markets to“show” us they have indeed fundamentally and technically turned the corner. At that point, regardless of what the “price” of the market is, the reward to risk ratio for increasing equity exposure in portfolios will be tilted heavily in our favor. Isn’t that what investing is really all about after all?
As Dick Russel once quipped:
“It’s better to be out of a bull market, than fully invested in a bear market.”
THE MONDAY MORNING CALL
I will readily admit that the recent rally over the last couple of weeks has certainly had me second guessing myself. I am human after all and am subject to the evils of emotional bias just as anyone is.
It is in times like these that I must force myself to re-focus on my discipline and strategy to manage portfolio risk effectively. But this does not mean that current analysis cannot be wrong. The financial markets are dynamic and evolving organisms. Events occur that impact markets in an unexpected manner. Therefore, analysis must also be dynamic and evolving in order to remain relevant. The shorter the time frame, the greater the impact the change in market dynamics will have on the accuracy of the analysis. This is why I tend to remain focused on weekly, monthly and quarterly data where evolutions in the markets have a much slower pace of impact to the accuracy of the analysis.
For example, earnings, which are announced quarterly, are one of the most important drivers of future stock market returns. I have addressed recently the ongoing deterioration in earnings and profits currently.
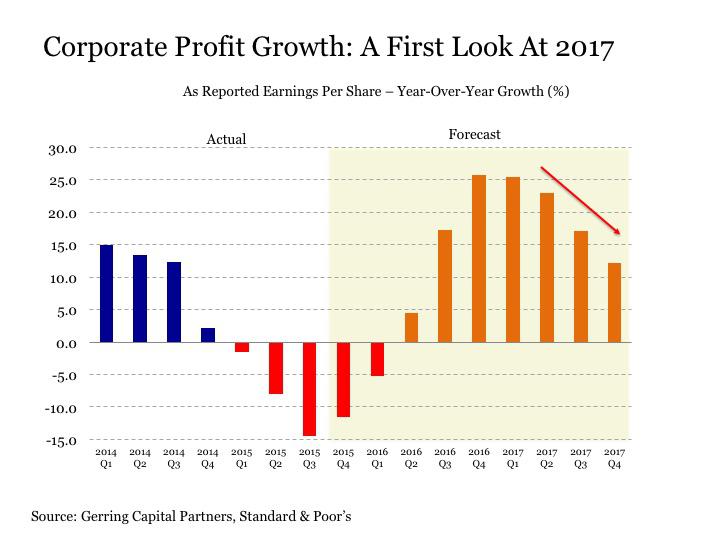
The importance of this cannot be dismissed. Since 1900, there have been 27 instances of EPS declines over a 2-quarter period. Historically speaking, such a rate of decline has coincided with a recession 81% of the time. The remaining 19% of the time, earnings re-accelerated for a short period due to short-term stimulus (either fiscal or monetary) which only temporarily delayed the onset of a recession.
The chart below shows the long-term history of earnings growth and the cyclical nature of earnings from 6% peak-to-peak growth to 5% trough-to-trough reversions. (I have provided where Goldman Sachs and Raymond James had predicted earnings to grow from 2014-2020 versus where we are currently.
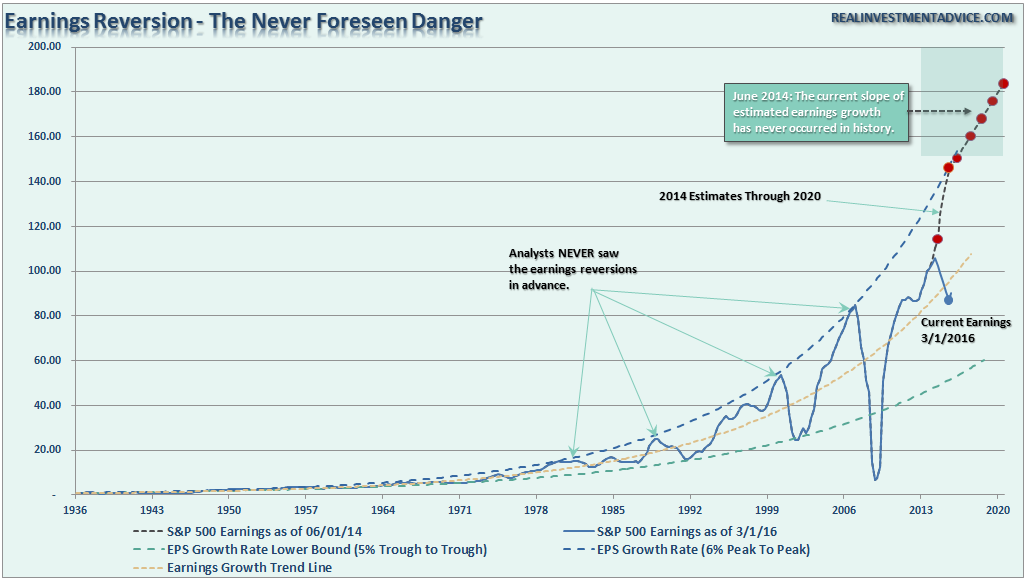
“Missed It By That Much.” – Maxwell Smart, Get Smart
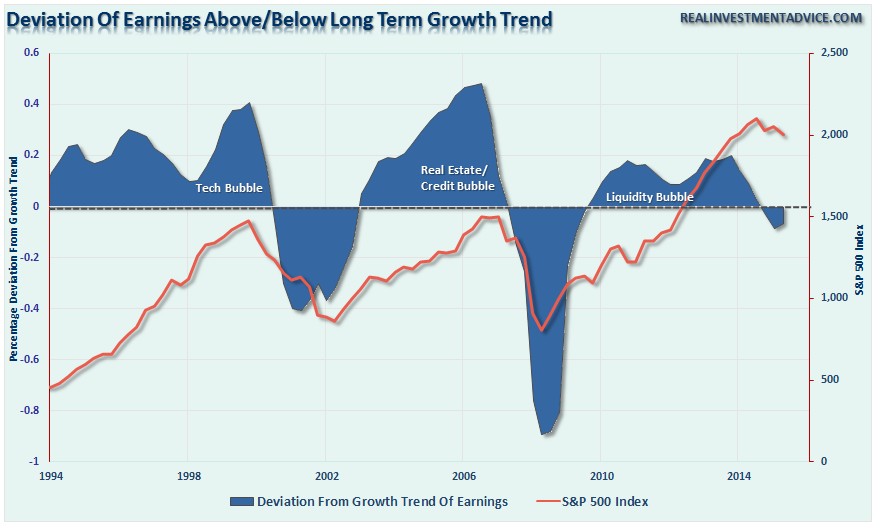
The next chart shows the current deviation in earnings growth from the long-term trend. Note that negative deviations have coincided with major market peaks.
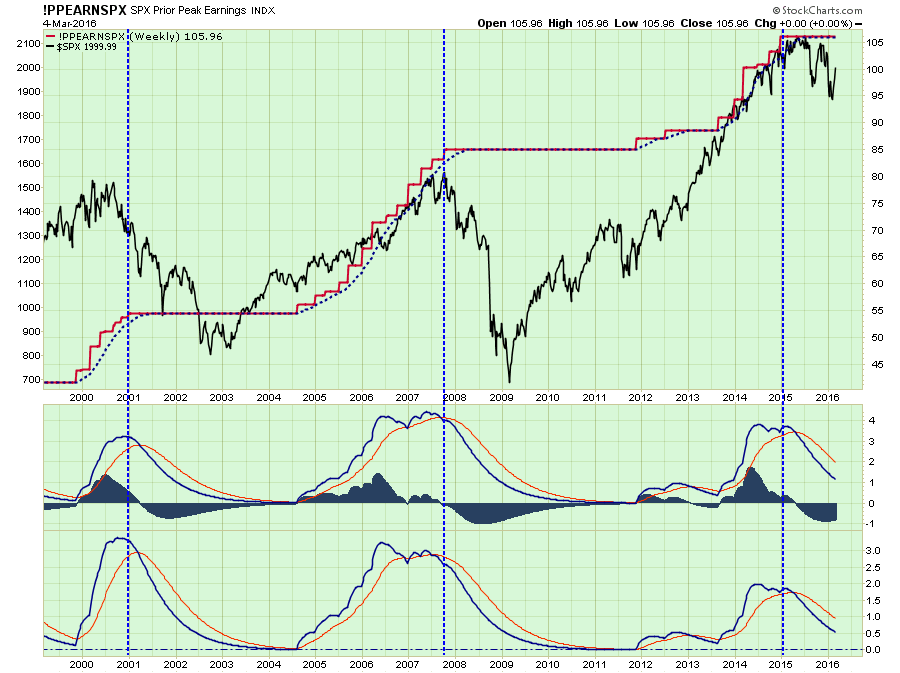
Lastly, the technical chart below shows earnings capped at the “prior peak” of earnings growth as compared to the S&P 500. Future outcomes have not been kind.
The point here is that while markets have bounced as of late, a major underpinning of future stock prices is still negative. Until a change to the positive begins to occur, the probability of lower prices continues to outweigh the possibility of higher ones.
Therefore, we continue to wait.
WAITING FOR CHANGE
As stated last week:
“There is now little for us to do except to wait, and watch patiently, for the market to either confirm a “bear market,” OR stabilize and begin to rebuild the bullish supports necessary to allow equity risk to once again be increased.”
Neither situation will make itself apparent in short order, so relax and we let the market dictate what actions we take next. “Guessing” at the markets has not typically been a successful and repeatable strategy.
While very short-term indicators have improved, the longer-term signals have not.