Uddrag fra Authers:
To be clear, valuation is of no use whatever in making a timing decision. A cheap market can always get cheaper. But it’s critical to choosing which stocks offer compelling returns over the longer term. This can be simply broken down into two components — the earnings you expect a company to make in the future, and the multiple of those earnings that investors are prepared to pay to buy the stock.
One of the simplest yardsticks makes stocks look more expensive than they have done in a decade. If you use the brutally clear-cut approach of choosing between equities and fixed-income by the effective interest rate they pay — the bond yield and the dividend yield — then the S&P 500 is looking its least attractive compared to Treasuries in a decade:
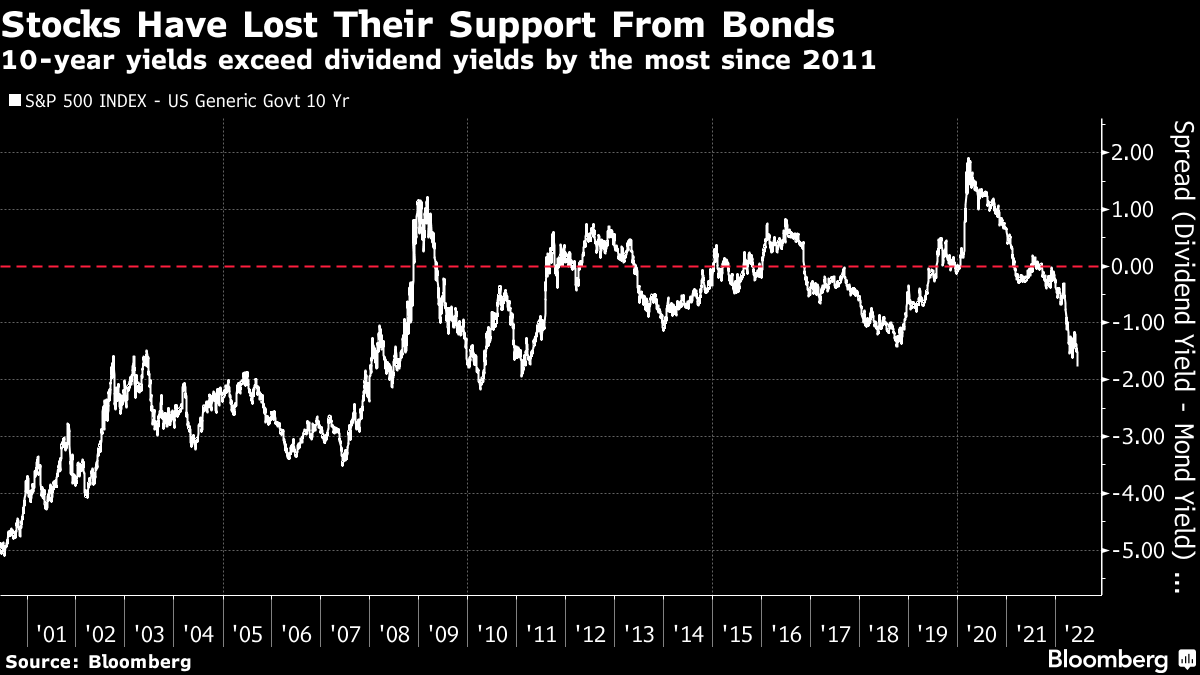
It was taken as axiomatic for decades that bonds should yield more than stocks, as compensation for their lack of growth potential. The moment when dividend yields exceeded bond yields in late 2008 was a crisis of confidence. But for the following decade, exceptionally expensive bonds offered support to stocks. This looks like a brutal return to the pre-Lehman world when stocks could not expect help from the bond market.
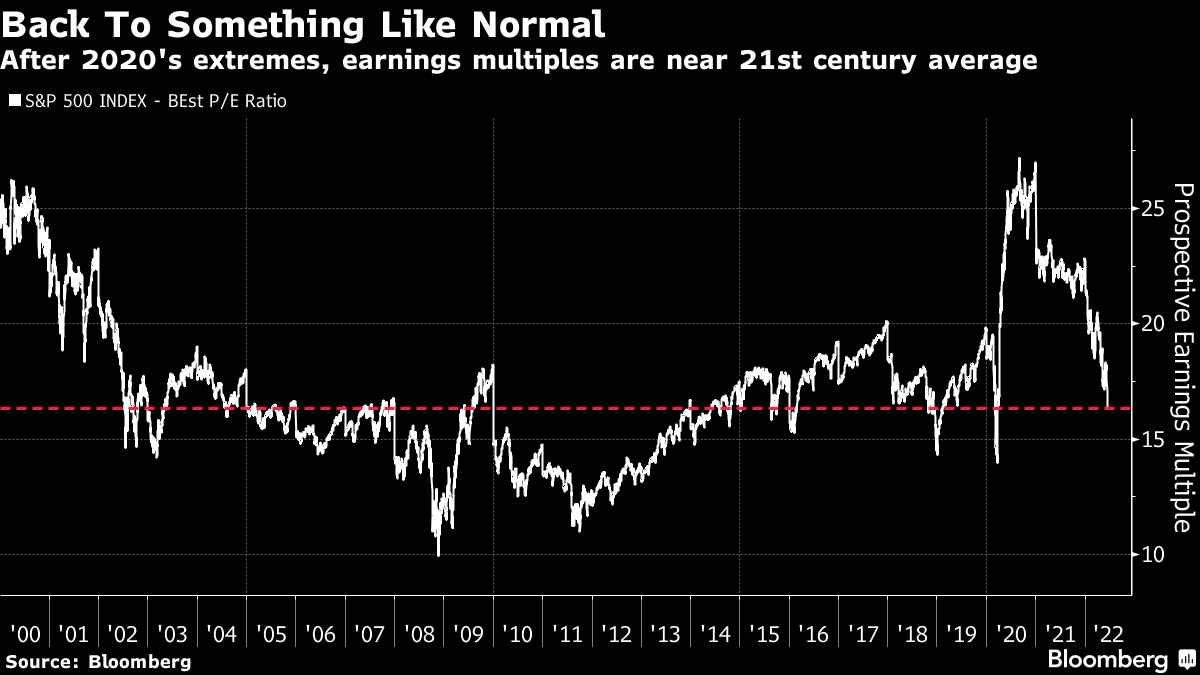
Judged compared to their own history, US valuations do now begin to look a little more defensible. As a multiple of expected earnings, the S&P 500 has returned to the middle of its range since the dot-com bubble. There’s no compelling case to buy, but there isn’t the screaming overvaluation of a few months ago:
Indeed, the entire selloff to date has been driven entirely by valuations. This chart, prompted by Ian Harnett of Absolute Strategy Research Ltd. in London, shows the rolling 12-month change in the S&P 500’s trailing multiple. The expansion in 2020, in response to the gusher of cash to deal with the pandemic, was the fastest on record, and it has now been followed by the most drastic compression on record.
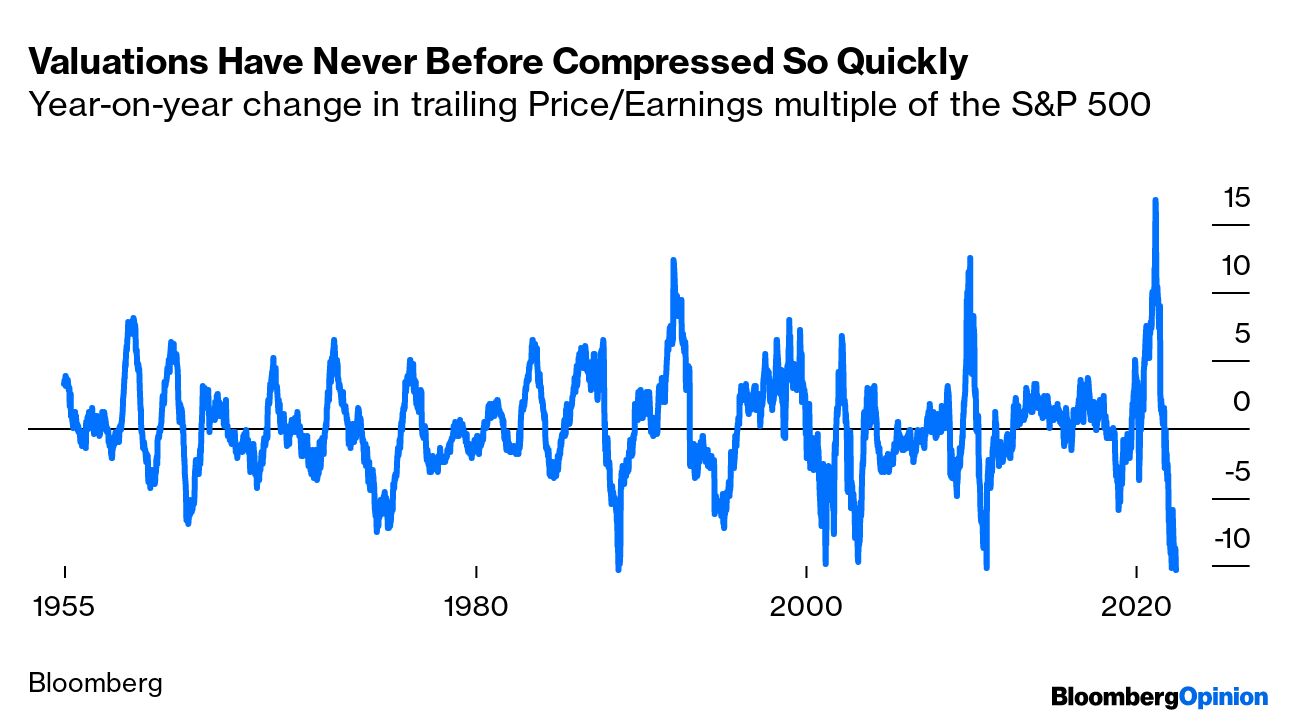
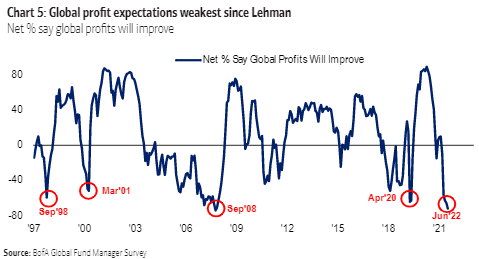
Valuations could certainly go lower still, but the bulk of the valuation-led part of the selloff is over. Now, the question is whether the earnings expectations on which those multiples are based are accurate. If expectations are over-optimistic and need to be cut, then there is room for share prices to fall further without much multiple compression. The BofA survey found serious bearishness about the profit outlook. Only in the immediate aftermath of the Lehman Brothers bankruptcy in 2008 has a greater proportion of fund managers expected global profits to fall:
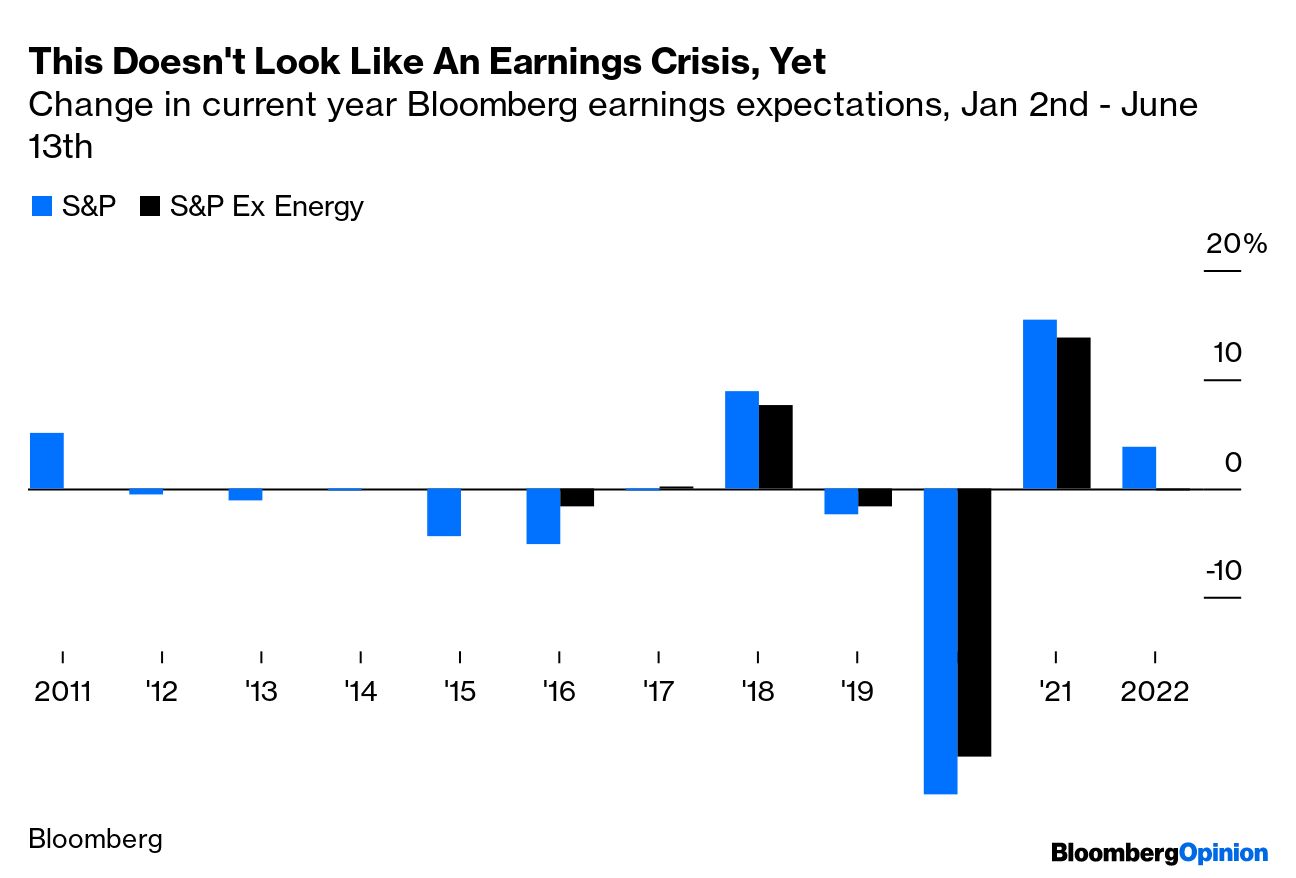
From the top-down point of view of the asset allocators who take BofA’s survey, then, it seems obvious that profits are coming down. Higher prices will eat into demand and revenues, higher rates will increase financing costs, wage demands will tighten margins, and so on. However, that is not the view of the brokers’ analysts who Bloomberg surveys to produce profit estimates. S&P 500 earnings expectations have risen 3% so far this year. Admittedly, this is mostly thanks to energy companies. Exclude them and forecasts are down minimally.
This isn’t normal. The following chart shows the shift in earnings forecasts for the full year by June 13, for each year going back to 2011. There are some big outliers caused by the Trump corporate tax cut in 2018, the pandemic in 2020 and the rebound from the pandemic in 2021. (That huge earnings surprise helped the stock market to perform as well as it did last year even as valuations began to compress). But the norm is for estimates to be down somewhat by the middle of June. That follows the standard corporate practice of companies lowering the bar as they approach it. The fact that forecasts are this resilient suggests genuine confidence amid the brokerage community that profits can keep rising:
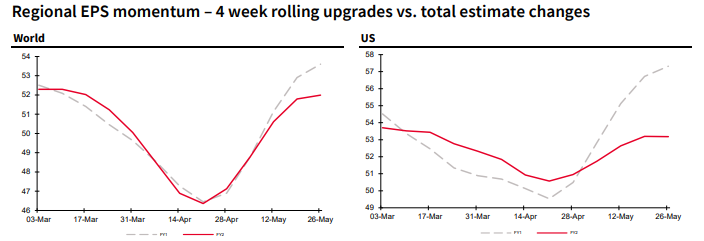
Another way to measure this is with earnings “momentum” — taking the percentage of the last month’s estimate changes that were positive. Any number above 50 shows positive earnings momentum, with more companies being upgraded than downgraded. The charts below were compiled at the beginning of this month by the quantitative team at Societe Generale SA. After a sharp dip in momentum by April, as estimates were written down to account for the impact of the Ukraine conflict, they started improving, particularly for this year but also for 2023:
The speed of the change in financial reality takes some adjusting to. There’s not much point going through a spreadsheet to update a model when the environment is so uncertain, while investor relations departments have similar reasons for keeping their own counsel. But it does look very much as though there is another shoe to drop. If companies have enough pricing power to get their customers to pay more for their goods, then all well and good. But the Fed is now on a concerted campaign to try to ensure that they can’t do that. If you don’t want to fight the Fed, you might want to factor lower profits ahead into your calculations.