Uddrag fra Deutsche Bank/ Zerohedge
The great rotation started last Thursday.
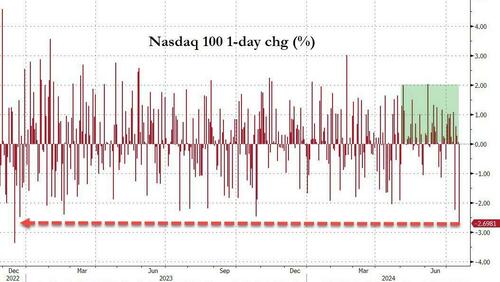
In what DB’s Jim Reid called a “fascinating day” for US equities. 396 of the S&P 500 were up on the day, the equal weighted index rose +1.17%, and the Russell 2000 small cap index (+3.57%) had its best day since November 2023. And yet, the overall S&P 500 fell -0.88%, which is the biggest gap between the overall S&P 500 and the equal weighted S&P 500’s performance since the Pfizer vaccine announcement in November 2020. The driver for start of the great rotation, of course, was a -4.26% fall for the Magnificent 7 – whose ridiculous skyhigh prices are the result of what even Goldman’s head of research admits is an AI bubble – the largest drop since October 2022, the month before chatGPT was launched.
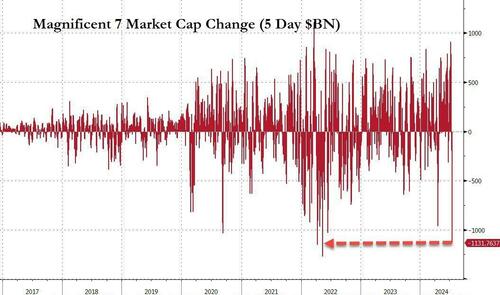
So in retrospect – and keeping in mind the historic rout for the Mag 7, which have lost over $1 trillion in market cap in just the last 5 days…
… the plunging Nasdaq which suffered its biggest one-day drop since 2022…
…. and the soaring small caps, Reid asks if this was the start of the next great rotation?
His answers is that “only a very brave, or perhaps foolish, person would have any confidence in such a statement, but it did remind me a little of the trends of 2000 when the peak in tech marked a huge rotation way before the overall market saw its largest falls.”
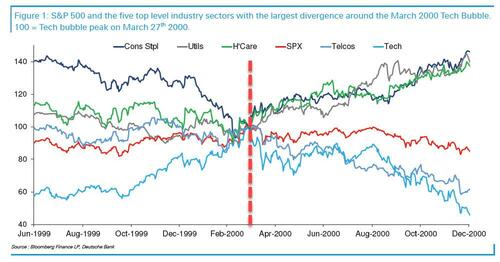
To highlight this, Reid shares the following chart which looks at the 5 sectors out of the 10 main top level S&P 500 sectors with the largest divergence around the bursting of the tech bubble in March 2000. In the chart, all indices are benchmarked to 100 at the peak in tech on March 27th 2000. In the lead-up to the tech peak, defensive sectors such as consumer staples, healthcare and utilities had been falling sharply which suggested a rotation out of seemingly steady, “dull”, stocks into high octane ones; in fact many were shorting these “boring” sectors to fund ever more longs in the tech bubble. However, when the tech bubble burst on March 27, 2000, money immediately rotated back into them and by year-end they were +35-45% higher from the point the tech bubble burst in March!
Interestingly for the overall S&P 500, while the index did dip -10% within three weeks of the bubble bursting, by September it was back at around the tech bubble highs, even though tech and telcos were down around -10% and -25% respectively. After this point these two sectors fell more precipitously which led to larger S&P 500 falls, but the three defensive sectors continued to climb.It wasn’t until deeper into 2001 and 2002 that the larger market falls took place, which coincided with the eventual recession and corporate fraud scandals of the time (e.g. Enron and WorldCom) which were only made possible by the mania of the first tech bubble (it makes one wonder what huge corporate fraud will emerge once the AI bubble bursts).
Alas, that was just the start: eventually Tech and Telcos lost around -85% and -75% of their value respectively from their peak at the lows in late 2002. At this point consumer staples were just over +25% higher from the tech peak in March 2000. So, as Reid notes, the ultimate rotation was a significant one!
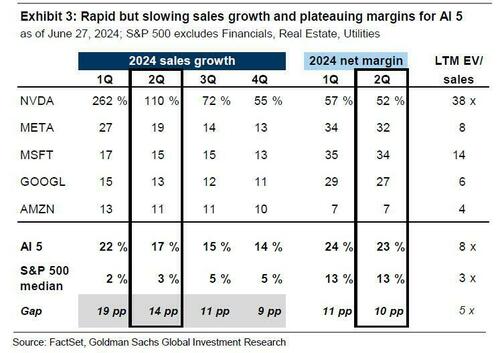
So much for the history lessons: bulls will immediately say that the dot com bubble is nothing like the AI bubble current market because back then (almost) none of the tech companies that made up the bubble had viable business models and anything resembling positive cash flow. Indeed, viewed this way this time is different: the Mag 7 are, for the most part, cash flow cows, generating tens of billions of cash every quarter, and more importantly, growing both their revenue and bottom line much faster than the remaining 497 stock.
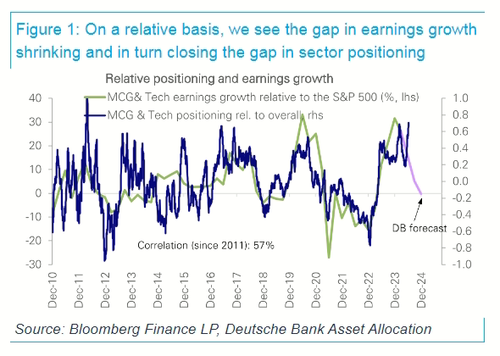
And indeed, in a follow up note from Reid (also available to pro subscribers), he notes that while overall positioning in the S&P 500 is very high, this is driven by extreme positioning in megacap growth and tech. Most of the other sectors have average or below average positioning. Here, Reid concedes that this divergence reflects recent realized earnings growth with the former seeing +38% YoY growth in Q1 and the later (i.e. the rest) only seeing +2.5% YoY growth.
But, as we discussed two weeks ago in “Now Comes The Hard Part: AI Stocks Face Brutal Q2 Earnings Day Of Reckoning“, DB’s strategists see this huge gap closing from both sides in Q2 and out to year-end, with +30% YoY and +7.5% YoY growth expected in Q2, respectively.
By year-end, they see this gap being eliminated with both in the low to mid-teens YoY growth range. Positioning should also follow with the associated implications for sector rotation (see above for what happened when investors fled the most concentrated sectors during the bursting of the first tech bubble). It’s therefore possible for most stocks to go up into year-end and the market be lower.
As Reid concludes, “It’s therefore possible for most stocks to go up into year-end and the market be lower.”
Intro-pris i 3 måneder
Få unik indsigt i de vigtigste erhvervsbegivenheder og dybdegående analyser, så du som investor, rådgiver og topleder kan handle proaktivt og kapitalisere på ændringer.
- Fuld adgang til ugebrev.dk
- Nyhedsmails med daglige opdateringer
- Ingen binding
199 kr./måned
Normalpris 349 kr./måned
199 kr./md. de første tre måneder,
herefter 349 kr./md.
Allerede abonnent? Log ind her

