Uddrag fra Goldman/ Bank of America/ Zerohedge
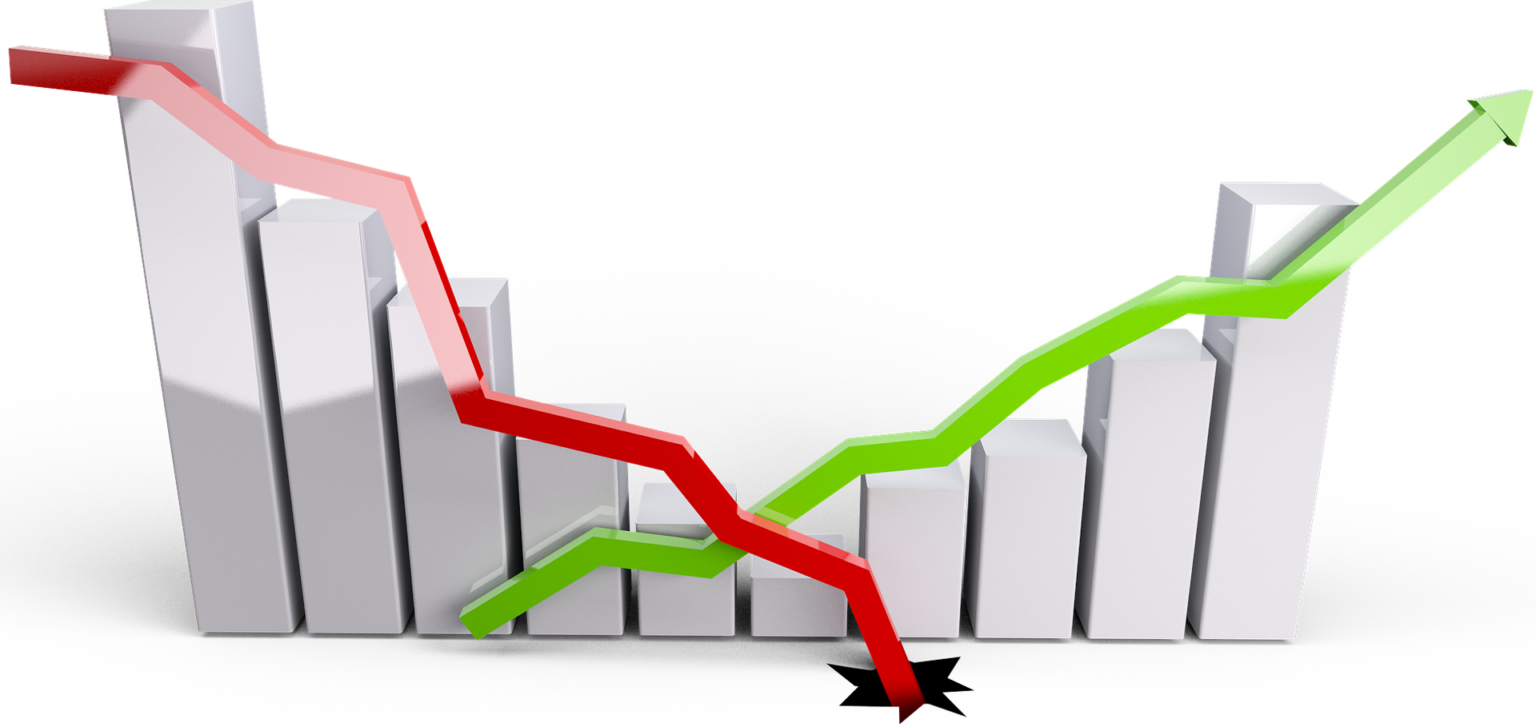
It’s hardly a secret that ever since the start of QE, and Fed micromanagement of equity capital markets, the single best trading strategy has been to BTFD, and for good reason: as Bank of America’s derivatives strategist Benjamin Bowler has been showing for the past decade,and explained again last December, the Fed has “knowingly injected moral hazard into the system from 2013 onwards, by stepping in (even if verbally) to rescue markets from very low levels of stress” something which is clearly shown in the remarkable chart below.

So is BTFD (aka Buying the Fucking Dip) still the only strategy that i) matters and ii) works consistently in this market?
That’s the question Goldman’s Christian Mueller-Glissmann and pals set off to answer in their latest note “The lowdown on the risk of an(other) equity drawdown” , and which – as one would expect – had a cheerful conclusion, finding that that US stocks are unlikely to slump 20% or more as the risk of a recession remains low against expected interest-rate cuts from the Federal Reserve (and even if that were not the case, Goldman would nver advise its clients to dump everything as that’s not how their business model works).
The team led by Christian Mueller-Glissmann said while stocks could decline into the year end the odds of an outright bear market are slim as the economy is also in part being supported by a “healthy private sector.” Additionally, the found that declines of over 20% in the S&P 500 Index have become less frequent since the 1990s – for the same central-bank central planning reasons noted above – driven by longer business cycles, lower macroeconomic volatility and “buffering” from central banks (which is another word for market manipulation and artificial boosting of the wealth effect for the top 1%)..
But what about buying this particular effing dip?
To answer this question, the Goldman strategists – who point to the 4% drawdown in early August that sent the VIX soaring above 60 for the first time since the covid crisis – first note that “drawdowns are a common feature of equities but their size and frequency has varied over time.” To wit, smaller equity drawdowns are common, occurring roughly half the time, while large equity drawdowns are more rare and most of the time coincide with recessions. On average, in the last 100 years there has been an S&P 500 >20% drawdown nearly every 4-5 years but in recent years bear markets have been less frequent, in large part because of expectations that the Fed and other central banks would step in and “save” investors.

Goldman goes on to note that the equity bull market in the 1990s was the longest, supported by structural tailwinds and the Tech Bubble, while the post-GFC cycle was also unusually long, but there were three large S&P 500 drawdowns that came close to a bear market: (1) the Euro area crisis in 2011 with 19.4%, (2) the EM/oil crisis in 2015 with 14.2% and (3) the drawdown in Q4 2018 came very close with 19.8%.
Looking at the bigger picture, there have been roughly 22 S&P 500 bear markets (drawdown >20%) since 1928 – the average bear market peak to trough is around 40% and has lasted 16 months. Drawdowns of more than 10% (but less than 20%) are more common – the average correction peak to trough is 13% and has lasted 4 months. In general, bear markets and equity drawdowns have become somewhat less frequent since the 1990s – according to Goldman, “this reflects longer business cycles and lower macro volatility, with the Great Moderation as well as more buffering from central banks owing to anchored inflation.” As to what “buffering” means, see above.

How has buying these dips done?
As Goldman also admits, since the global financial crisis, ‘buy the dip’ of the S&P 500 has been a successful strategy in response to any 10% drawdown or more. The average subsequent returns from simply buying the S&P 500 after a 10%+ dip were higher than the average since 2010; hit ratios were also higher.

However, 5-year returns suggest that by just buying the dips investors missed out on some very strong return periods without any drawdowns. Still, the success of ‘buy the dip’ also meant that strategies selling insurance on equities, such as put selling, had strong risk-adjusted returns.
That said,a simple ‘buy the dip’ strategy for the S&P 500 since 1990, which includes the Tech Bubble burst and the GFC, has had worse near-term returns and hit ratios. Surprisingly, only a ‘buy the dip’ strategy for larger than 20% drawdowns has had average returns marginally better than unconditional ones but lower hit ratios – and not for longer time horizons (>2-year). The same is true for a ‘buy the 20%+ dip’ strategy since 1928 – there is a small improvement in near-term returns but hit ratios only improve over very long horizons but average returns tend to be lower.

Putting it together, Goldman finds that whether buying the dip is a good strategy depends on whether equity drawdown risk lingers. After an equity drawdown, the asymmetry is often better as valuations decline and sentiment and positioning become more bearish, but there is often risk of further deterioration of macro and market conditions.
An equity drawdown can also result in tighter financial conditions, which can further weigh on macro momentum, creating an adverse feedback loop where selling begets even more selling until a central bank is forced to “short circuit” the loop. Only after material declines in sentiment and positioning or valuations is the asymmetry to add risk often better, irrespective of subsequent macro conditions.
Finally, what about this particular dip?
Here, Goldman’s traders write that sharp declines in the bank’s Risk Appetite Indicator (RAI) historically have signaled a better asymmetry for risky assets. The hit ratio of positive S&P 500 returns in the subsequent 6-12m from levels below -2 is above 90%. With 27 risk premia and pair trades across assets it does capture the breadth of de-risking and, as it is based on 1-year rolling z-scores, it incorporates the speed of the sell-off, which increases the potential for an overshoot. As Goldman wrote on August 6th, the bank’s RAI collapsed to one of its lowest levels since the 1990s intraday on August 5th, mostly due to the VIX spike, troughing at -2.6 before recovering to -1.3 by EOD – there was not the breadth that usually signals better asymmetry.

That said, the August 5 plunge feels like it was years ago, and since then risky assets have fully recovered, and after the recent volatility, the RAI has now settled at -0.8, signalling less positive asymmetry on a stand-alone basis. Goldman would suggest caution because from negative RAI levels above -2, there can be larger S&P 500 drawdowns in the next 6 months in case of weaker subsequent growth data.

Separately, the fact that safe assets have not sold off more materially indicates to Goldman that there is less complacency. Still, the bank believes near-term equity drawdown risk will be conditioned by US and global growth data and if central bank easing helps further ease growth concerns
Logically, a larger valuation de-rating can also result in a better asymmetry (i.e. upside) for forward equity returns. For example, a sharp valuation reset without large declines in earnings like in Q4 2018, one of the largest since the 1970s, indicates material risk to earnings is already discounted. Equity valuations tend de-rate ahead of profit recessions but tend to overshoot – in several cases, subsequent earnings declines were small. Valuation de-ratings >15% tend to improve average S&P 500 returns and hit ratios on a 12-month horizon, according to Goldman, which also makes sense: the greater the crash, the bigger the eventual rebound… at least until the last one after which there is no rebound.

Finally, the Goldman analysts note that near-term returns are again mixed outside of the largest valuation de-ratings. On a 6-month basis, there can still be large S&P 500 drawdowns (20%+) even after large valuation de-ratings. Only in case of a >20% de-rating and if no profit recession is expected, the asymmetry is quite positive. In the case of smaller de-ratings (10%-20%) such as the recent ones, investors can consider buying the dip if they expect earnings growth to remain positive. However, and this is a rare moment of bearish objectivity from Goldman, the recent valuation de-rating is small and earnings revisions have been flat to negative across markets YTD (outside of Japan).