Uddrag fra Goldman Sachs trader and portfolio manager
A US recession is a key regime differentiating point with meaningful impact on US and global financial assets and tactical asset allocation. What is priced in?
1y ahead SOFR: 39.4%
- The pricing of recession moved from 30% last week (40% in EUR) to nearly 40% in US and nearly 50% in EUR.
- This is now a full swing vs April when we were pricing 30% prob of next move being a hike and only 10% probability of recession.
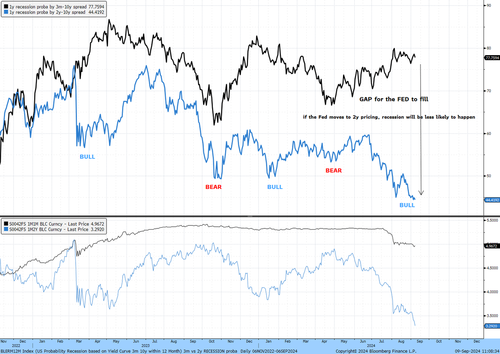
Chart 1. G3 short end implied probability of recession

US yield curve: 3m-10y 77.8%, 2y-10y curve 44.4%
- 1y recession probability implied by SOFR (39.4%) has now converged with the 2y-10y implied probability (44%).
- The gap between 3m vs 10y curve 78% and 2y vs 10y curve 44% implied probability of recession means that policy rates need to go below 3.5 to avoid a recession. This is consistent with the market views of higher near term equilibrium real rate of 1.5%
The Fed vs FCI contingent loop – the Fed is not too far behind the curve and a faster return to neutral can prevent a recession
- While the rate market has provided meaningful accommodation in forward terms, the Fed will still have to deliver and lower floating rate costs and reduce the propensity to save for the economy. In the short term, it is the interaction between Fed policy and FCI (US equities) that will deliver the 80% probability of recession or the 40% one.
- We assume that FCI shocks during or adjacent to periods of low or negative real rates do not affect unemployment while FCI shocks following periods of high real rates can have large impact on unemployment.
- If the Fed doesn’t look ready to close that gap quickly, stocks are likely to sell off further to price the higher probability of recession and lower earnings growth. Under the assumption that FCI shocks have higher impact on unemployment following extended periods of positive and high real rates, a 1.5 to 2.0 pp of FCI tightening via equities could be sufficient to bring the unemployment rate in recession territory (above the long term trend average of 5.3%).
- If the Fed is keen to close the gap quickly, the probability of recession will drop to what is priced by the 2y-10y curve and stocks should eventually rally with FCI and real rate easing providing sufficient stimulus to reset the cycle. The curve is likely to bear steepener, lowering the implied 2y-1y recession probability further.
- In our view, , the Fed is not too far behind the curve as some might fearthe policy rate is still in line with nominal growth rather than above it for an extended period in time as it was in 1981-82, 1989-90, late 2000-early 2001 or in 2007.
Are there any convexity hedges left?
- Payouts in front end SOFR call spreads and VIX call spreads have halved compared to the levels we flagged in early July. For example the premium to payout ratios for 100bps call spreads (ie buying 2% vs selling 1% SOFR rates or the 98-99 SOFR Call Spread now offers 7.5x prem to p/o for Dec 2025 vs 16.0x in July ).
- What we still like: FX vol ie EURUSD 1y at 6.15, USDZAR 1y vol and risk reversals close to cycle lows or , a proxy for high yield spreads widening via a C/A deficit EM sovereign like Turkey where 5y CDS is trading at 270bps
- We also like to be long the GS US FCI (GSINFCI1 Index) and GS EU FCI (GSINFCI2 Index) macro baskets vs illiquid carry / private credit / or other recession sensitive risk asset exposure investors might need to hedge.
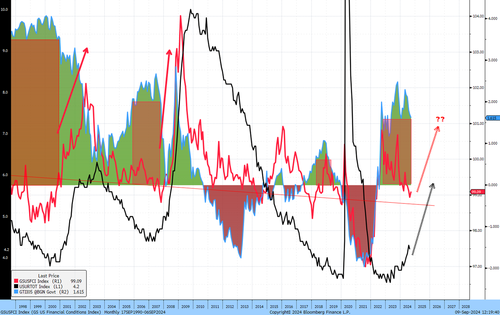
Chart 4. Key US macro financial variables.
- Real rate and the real curve a more restrictive than in 2019 which is our template for recession being avoided by pro-active Fed (the Covid shock was exogenous and the economy was recovering into March 2020).
- The FCI trajectory has decoupled by the 25/75 manufacturing / services ISM. We see this as end cycle development, less growth traction from easier FCI but higher growth traction from tighter FCI.
- The front end (1y1y) US CPI zero coupon swap are not in recession pricing territory, even with oil prices weaker they are at 2.25 showing remarkable resilience vs 2019 levels (1.8).

Chart 5 The Fed policy rate is still in line with nominal growth rather than above it as it was in 1981-82, 1989-90, late 2000-early 2001 or in 2007


Chart 6 Cheap recession hedges EURUSD 1y FX vol at 6.15, Turkey 5y CDS at 270bps

Chart 7 Cheap recession hedges 1y USDZAR vol and risk reversals