I have not updated a pair of recession indicators for a while, one of them is mine. Let’s discuss.
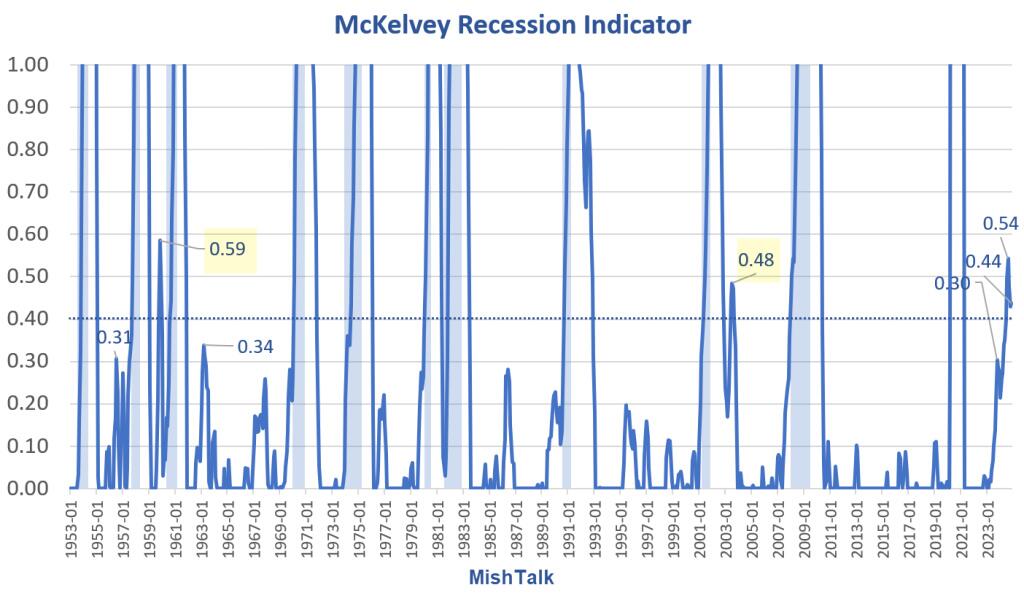
What is the McKelvey Recession Indicator?
Take the current value of the 3-month unemployment rate average, subtract the 12-month low, and if the difference is 0.30 percentage point or more, then a recession is likely.
Edward McKelvey, a senior economist at Goldman Sachs, created the indicator.
Different Trigger
The problem with the indicator is that it has many false positives.
I suggest a higher trigger. If we use a trigger of 0.4, the number of false positives since 1953 drops from five to two.
For six consecutive months McKelvey has been at or above 0.4, with the last five months above.
An Alternate Trigger
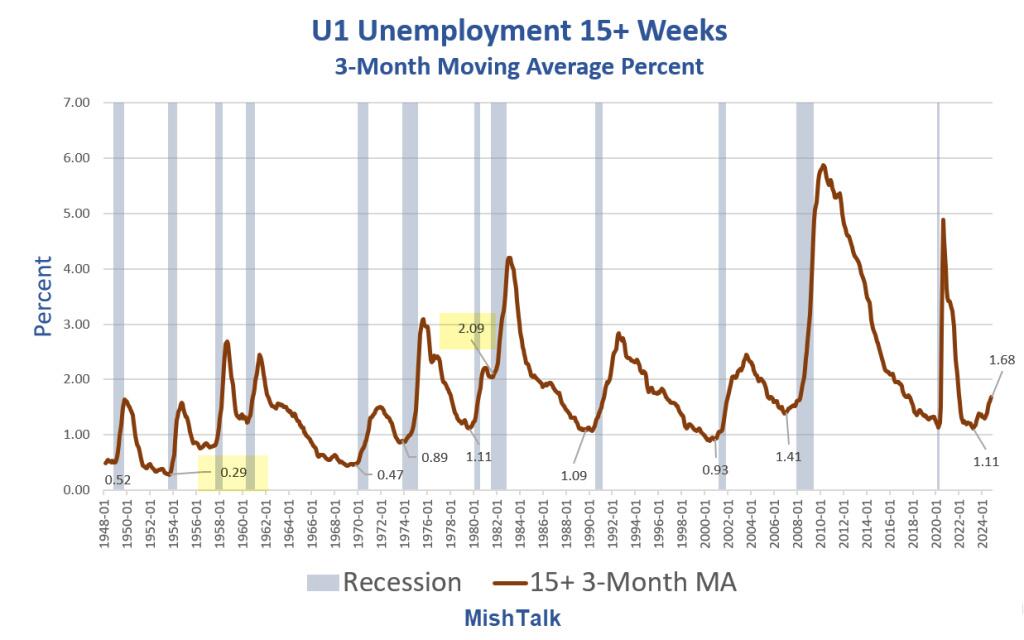
I devised a second moving average indicator based on 15+ weeks of unemployment.
Consider the following chart.
U1 Unemployment 15+ Weeks
It’s clear the above chart is troubling. But how troubling? Recessions can start at levels as low as 0.29 percent or as high as 2.09 percent.
But it’s the direction and rate of change that matters the most, not the level.
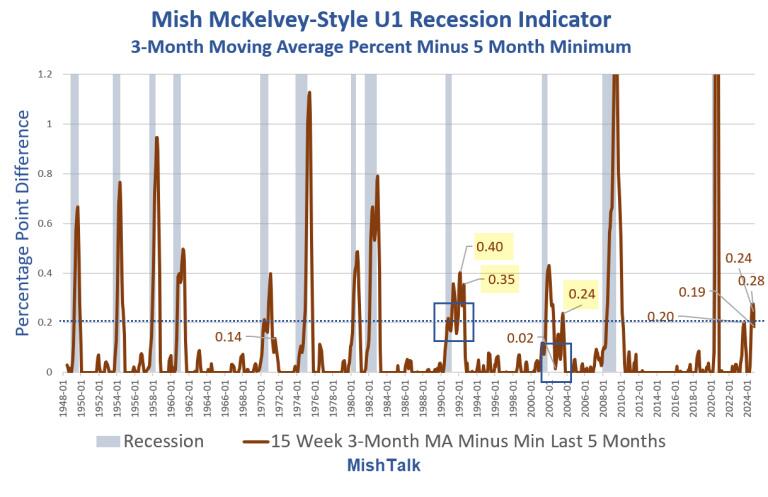
Using the excellent work of McKelvey as my guide, I created the following chart.
Mish McKelvey-Style Recession Indicator
What is the Mish McKelvey-Style Recession Indicator?
Take the current value of the 3-month moving average of the U1 unemployment rate average, subtract the 5-month low, and if the difference is 0.20 percentage point or more, then a recession is likely.
My indicator is a more lagging indicator that McKelvey and it needs to reset. The apparent false positives in 1992-1993 can be discarded as continuing weakness from the previous recession.
In 2003, my indicator nearly reset to zero, hitting 0.02. That’s close enough. I concede a false positive on the rise to 0.24 in August of 2003, using a reset trigger of 0.10.
Synopsis
We have a leading recession indicator (McKelvey) and my more lagging indicator both giving recession warnings.
My indicator weakened to 0.19. That’s partly because of a faster rollover (5 months vs 12). But historically, dating to January of 1948, any signal above 0.15 on my indicator is a warning.
McKelvey ticked up slightly in November to 0.44 from 0.43 last month.
Together, the indicators imply a very strong warning that something is seriously amiss in the labor markets.


