Uddrag fra Goldman Sachs:
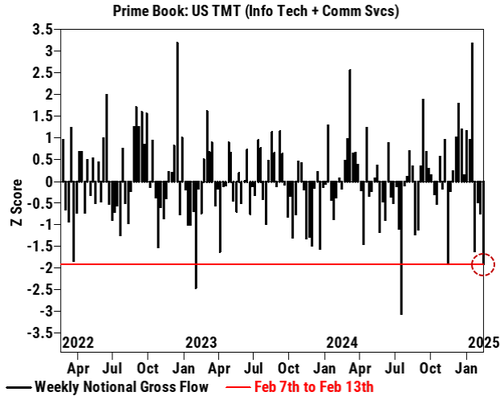
One week ago we noted that hedge fund sentiment hard-reversed again, and after breaking a streak of 5 consecutive weeks of selling with a week of solid buying the week prior, last week saw a fresh spike in notional de-grossing in US Tech/Media/Telecom (TMT) which was the largest since July ’24 and ranked in the 98th percentile vs. the past five years (and just ahead of the tech rout that would follow).
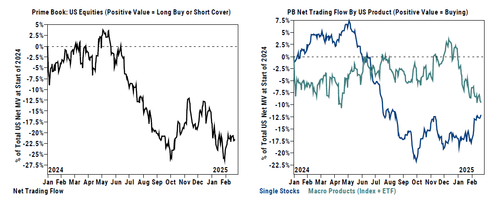
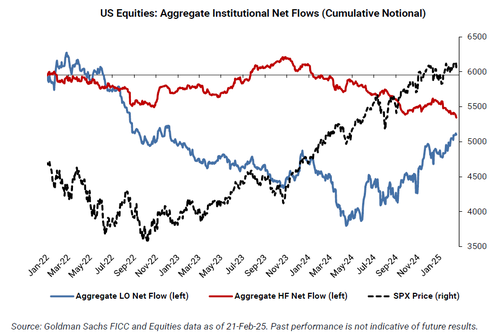
Fast forward one week to this weekend, when we find in the latest Goldman Equities Weekly Rundown note that hedge funds did little of note across the broader market of single stocks in the past week (i.e., “there was little net activity, driven by risk unwinds with short covers slightly outpacing long sales. Industrials, Staples, Materials, and Energy were the most notionally net bought sectors, while Consumer Disc and to a lesser extent Health Care were among the most net sold“) as the retail euphoria finally cracked and the momentum stocks lifted to nosebleed levels by retail traders finally crashed (as described in Retail Favorite Momentum Names Are Crashing: Here’s One Reason Why), but more notably, the renewed bearishness across tech accelerated and in the latest week, “hedge funds aggressively unwound longs in TMT stocks (Info Tech + Comm Svcs) for a second straight week, driven by long sales as well as short covers.”
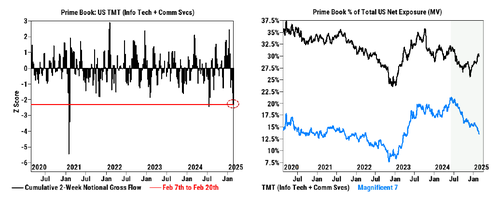
As shown in the first chart below (left), in notional terms over a 2-week period, Goldman Prime calculates that the magnitude of recent de-grossing in US TMT is now on par with what we saw last July and among the largest in the past five years (99th percentile), led by Semis & Semi Equip (short covers > long sales), Interactive Media & Svcs (long sales > short covers), Entertainment (long sales > short covers), and Comm Equip (long sales > short covers).
Furthermore, and as shown in the second chart below (right) as we approach NVDA earnings this coming week, Net exposure to Mag7 names has continued to fall and is now at the lowest level since Apr ’23.
What else did hedge funds do in the past week? Nothing too exciting actually.
As noted above, Single Stocks saw little net activity, driven by risk unwinds with short covers slightly outpacing long sales. Industrials, Staples, Materials, and Energy were the most notionally net bought sectors, while Consumer Disc and to a lesser extent Health Care were among the most net sold.
Meanwhile, Macro Products (Index and ETF combined) were net sold for an 8th straight week, driven by short sales outpacing long buys ~6 to 1 on light notional activity, but it remains unclear if this is a bearish or bullish contrarian sign, since most hedge funds tend to aggressively short market proxies such as SPY or QQQ, as the short leg of pair trades with favorite high-conviction longs. Which is why some claim that a pile up in ETF shorting is actually a bullish sign.
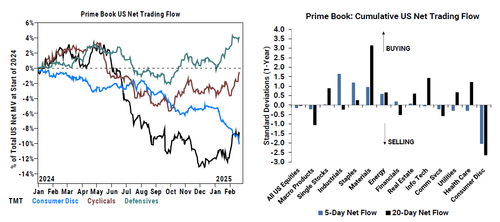
Finally, hedge fund managers net bought Cyclicals for a 3rd straight week (5 of the last 6) and at the fastest pace in more than 4 months, driven by risk on flows with long buys outpacing short sales ~4 to 1. All cyclical sectors were net bought on the week, led by Industrials (short covers + long buys), Materials (long buys), and Energy (long buys > short sales).
On the other hand, Consumer Disc was net sold for a 9th straight week and is by far the most net sold sector so far in February and YTD.
Goldman’s Share Sales trading desk (which is distinct from the Prime Brokerage) confirms that hedge fund sentiment has soured dramatically, and as Goldman’s Mike Washington wrote late on Friday, from a flow perspective, “hedge funds drove a great majority of the activity on our desk, finishing -$2.5b net sellers driven by de-risking in tech and consumer while selectively pressing shorts in retail exposed.” At the same time, vanilla Asset Managers finished balanced on the week, “mostly frozen watching and not stepping in buying any of dislocations yet.”
For those who missed our Friday recap, here is a snapshot of the key topical themes across sectors in a week that saw an unexpected spike in market turmoil:
Financials: saw broad signs of de-risking, showing up in 1) capital markets exposed names and 2) cyclicals (banks, high growth payments). Earnings misses in payments being significantly punished and people finding it hard to defend until round trip back to pre-election levels (which capital markets has been seeing a similar dynamic).
- Healthcare: outperformed on the week, benefitting from the broader momentum unwind (mostly in TMT + consumer) that drove a defensive bid in HC. That said, many EPS updates continued to be wrong-way with consensus positioning and there were pockets of notable idiosyncratic risk (see UNH on headline risk) that weighed on performance.
- Consumer: what is good for WMT is not always good for others. The aggressive shift in dialogue around consumer health seems like it’s moved too far, too fast. Some of the choppiness can be explained by weather (weather exposed companies are the ones primarily speaking to weakness), seasonality (low volume spending months) and F/X impacts. If we do not see a reversal of trends on more normalized weather in March, then there will need to be a deeper debate on what exactly is driving the choppiness (tariffs, inflation, jobs).
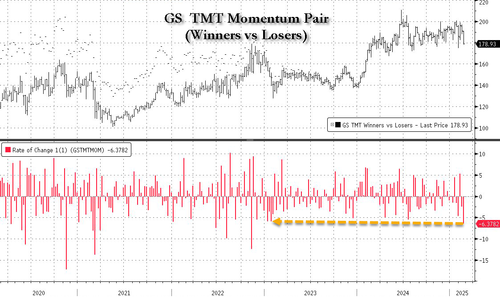
- Tech: TMT Mo’ Pair (GSTMTMOM) down ~640bps this week (worst week since Jan’23), a number of ‘high-flyers’ lost their footing (e.g. NET, PLTR, AXON), and Secular Growth (GSXUSGRO) finished the week -670bps, marking its biggest underperformance relative to the NDX since late 2022. While it often feels like the ‘drivers’ of these drawdowns are more macro in nature (rates, inflation, shift in growth expectations), this move has felt more idio with a handful of earnings ‘misses’ in the high-flyers (CVNA, TTD, RBLX, DDOG, RDDT) and/or 2-way ‘news flow’ (APP, PLTR, AXON). Feedback and opinions a bit more 2-ways.
Unfortunately, as the ongoing selling by hedge funds strongly signals, the rough patch for the market may just be getting started. One reason for that is that as Goldman notes, unless the SPX stages a sharp and powerful reversal, the technicals are about to turn very bearish:
- we are nearing S&P 500’s 50dma of 6010 which was the key level to hold going into the close / weekend.
- CTA short term momentum flips from positive to negative with S&P 500 below 6042….AKA below this level $8b of US equities for sale next week.
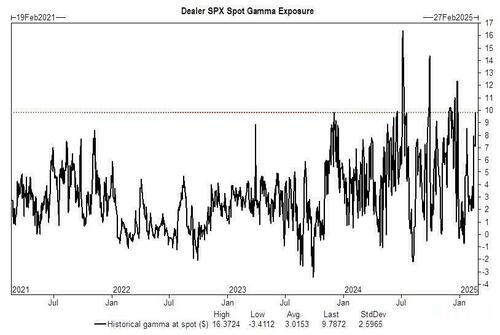
- Meanwhile, as we discussed last week, the current very high dealer gamma position – which provided a solid buffer for stocks in either direction – rolled off by ~50% after Friday’s option expiration expiry, and “the market will have the ability to move more freely next week”…. by which the Goldman trader clearly means continue selling off.
Last but not least, we go to the traditionally cheerful John Flood, who over the weekend published an unexpectedly downbeat report (full pdf available to pro subs), in which he adds to the bearish pile up and warns that “several warnings signs are currently flashing around positioning, valuation, breadth, concentration and policy.”
Below we excerpt from the full note:
The S&P 500 eked out 2 more fresh ATH’s on Tuesday/Wednesday but ended the week with a thud dropping -171bps Friday (the worst day of performance since 12/18/24) in the midst of $2.7 trillion of options exposure expiring.
- On the bright side the S&P 500 was able to hold its 50dma of 6010 which remains a key technical level of support to keep a close eye on.
- On the not so bright side CTA’s short term momentum flipped from positive to negative with S&P 500 closing below 6042 which unlocks ~$8b of U.S. equities that will be sold this upcoming week.
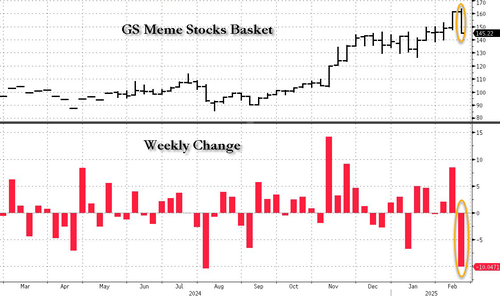
Several warning signals are currently flashing around positioning, valuation, breadth, concentration and policy. The degree of difficulty remains high. Retail community appears to be have taken a breather from buying stocks (that’s one way of putting it) as Goldman’s Memes Basket (GSXUMEME INDEX) dropped just over 10% last week.
Hedge Fund PnL destruction was real with HC and Consumer the focal points of the pain. Asset managers remain on sidelines and have not yet stepped in to buy any of these dislocations (as Washington noted above, they are “frozen”). According to Flood, “Rotating some $ out of S&P 500 into Russell 2000 continues to makes sense here.”
All eyes now turn squarely on NVDA earnings post close this Wednesday: Stock range-bound for ~8 months now as complexity has picked up (ASICs vs Merchant, DeepSeek, Blackwell timing, GMs contracting q/q, etc)… Near-term market expectations feel relatively in check with feedback suggesting investors somewhat braced for a more modest beat/raise cadence than the ‘normal’ (~$1-2bn beat + a q/q guide up of +$2bn q/q) given the hand-off from Hopper to Blackwell products (for context, cons = Jan revs ~$38.1bn + April revs ~$42.2bn) .. arguably, more focus on commentary into July qtr (timing of Blackwell? China demand?) and broader comments to help settle 2026+ debates.
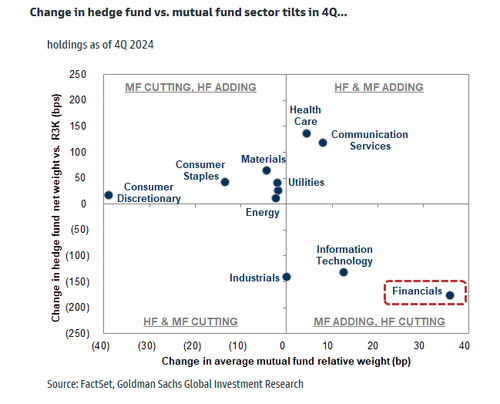
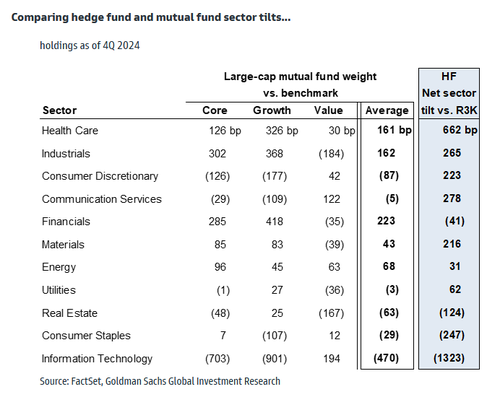
Separately, Flood notes that last week Goldman’s Portfolio Strategy research team published two of the bank’s most widely read reports of the year in Mutual Fundamentals and HF Trend Monitor (both available to pro subscribers). Mutual funds leaned into Financials while HFs backed away. MFs increased their overweight in fins by 36 bp to 223 bp in 4Q, the largest of any sector. In contrast, HFs flipped from 135 bp overweight Financials in 3Q to 41 bp underweight in 4Q, the largest cut across sectors. However, the net tilt in the sector still ranks in the 95th percentile vs. the past decade. HFs were more selective in the sector, as COF and AJG entered our Hedge Fund VIP list.
Both MFs and HFs generally trimmed exposure to the Mag 7, with TSLA the notable exception. TSLA was the most added to stock among large-cap mutual fund managers and the stock ranked in the list of “Rising Stars” among HFs.
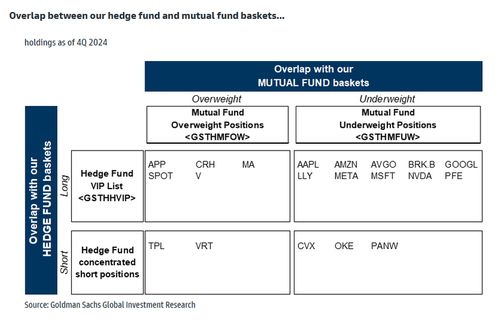
Despite these changes in positioning, the Mag 7 ex-TSLA still rank as the top stocks in Goldman’s Hedge Fund VIP list and the average large-cap mutual fund remains 790 bp underweight the Mag 7 in total.
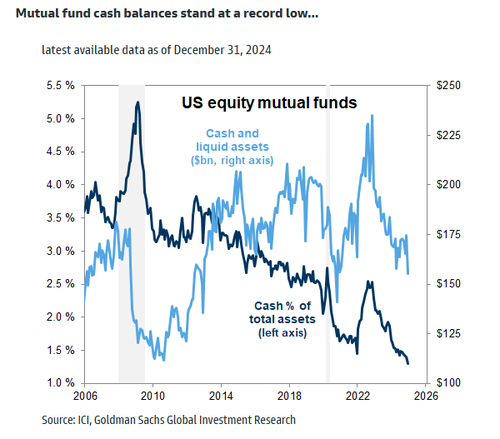
And a problem for those hoping funds will step in and buy the dip: they can’t – Mutual Fund cash balances are at a record low.
Finally, turning to what may be a very turbulent week if Goldman is right, the big even as noted above is NVDA earnings on Wednesday. There is a mix of Macro (US Consumer Confidence Tues, GDP Thurs, and PCE Fri) and Micro (retail earnings). The option-implied implied move in the S&P through 2/28 is 1.27%.
Intro-pris i 3 måneder
Få unik indsigt i de vigtigste erhvervsbegivenheder og dybdegående analyser, så du som investor, rådgiver og topleder kan handle proaktivt og kapitalisere på ændringer.
- Fuld adgang til ugebrev.dk
- Nyhedsmails med daglige opdateringer
- Ingen binding
199 kr./måned
Normalpris 349 kr./måned
199 kr./md. de første tre måneder,
herefter 349 kr./md.
Allerede abonnent? Log ind her


