
Uddrag fra Marketear
Levels associated with a bounce
We should really bounce around here. Technical and sentiment indicators support a long trade. We (and most others) seem to believe this, which in itself is a problem… There are also however significant risks for a real “break-down” due to mechanical factors. Let’s look at five bounce reasons and then the five apparent mechanical risks to the downside.
1 – Very close
“In aggregate, the 4wk change in our US Tactical Positioning Monitor reached -1.45z as of early March, which is very close to the -1.5z level that would generally indicate a positive set-up for US stocks.”
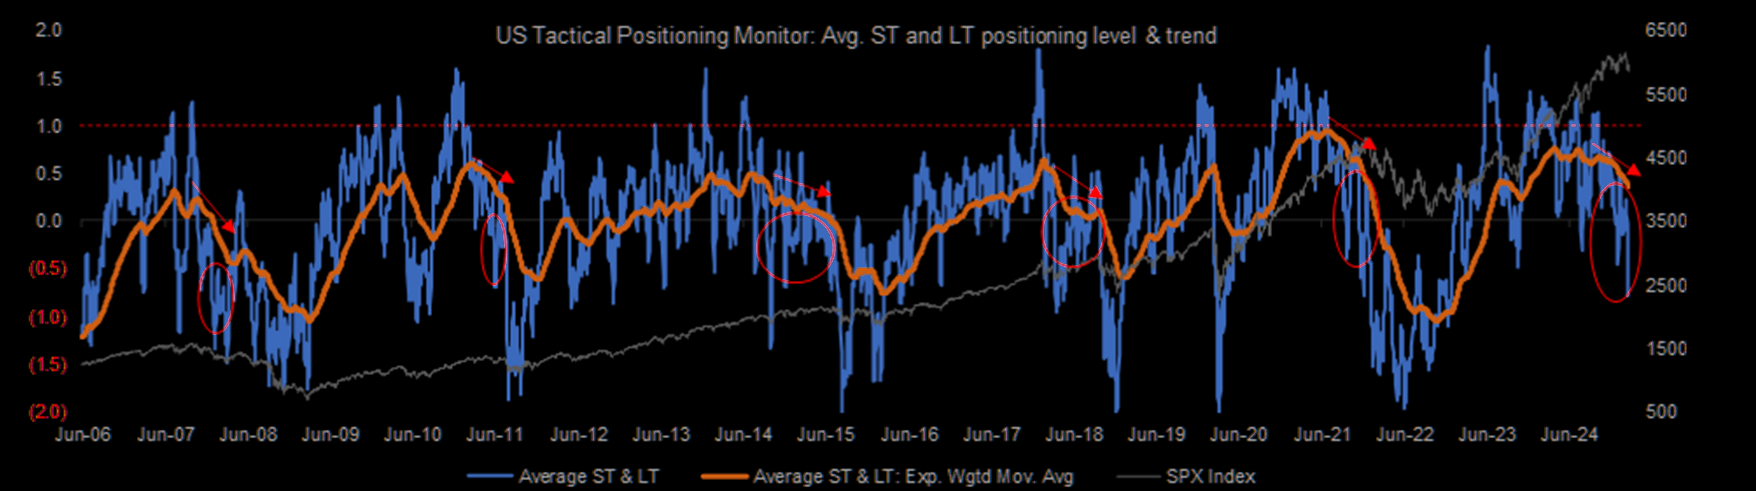
Source: JPM PI
2 – Right around “attractive”
4 week change of TMP right around “Attractive” threshold & 1yr Z-score of positioning low already.
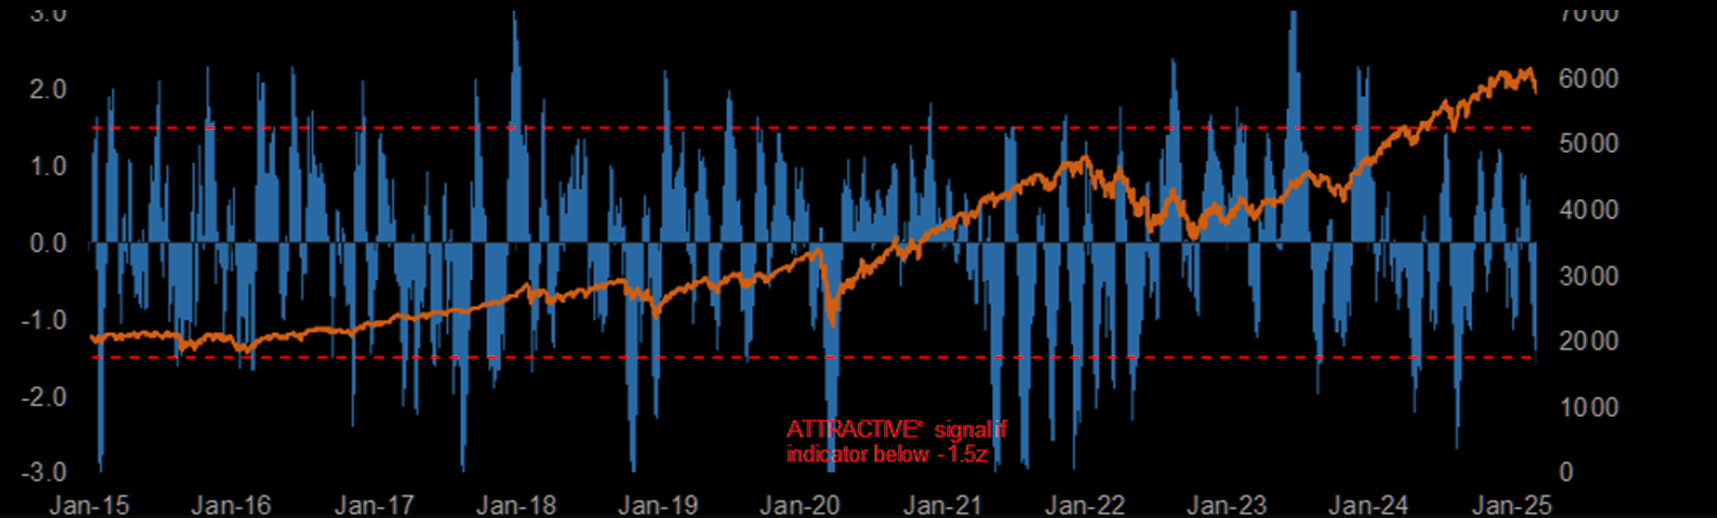
Source: JPM PI
3 – Close to the “average” trough level
The Morgan Stanley Global Risk Demand Index is deeper into ‘Fear’ territory at -2.7, moving closer to the average trough in the last 10Y at -3.2…
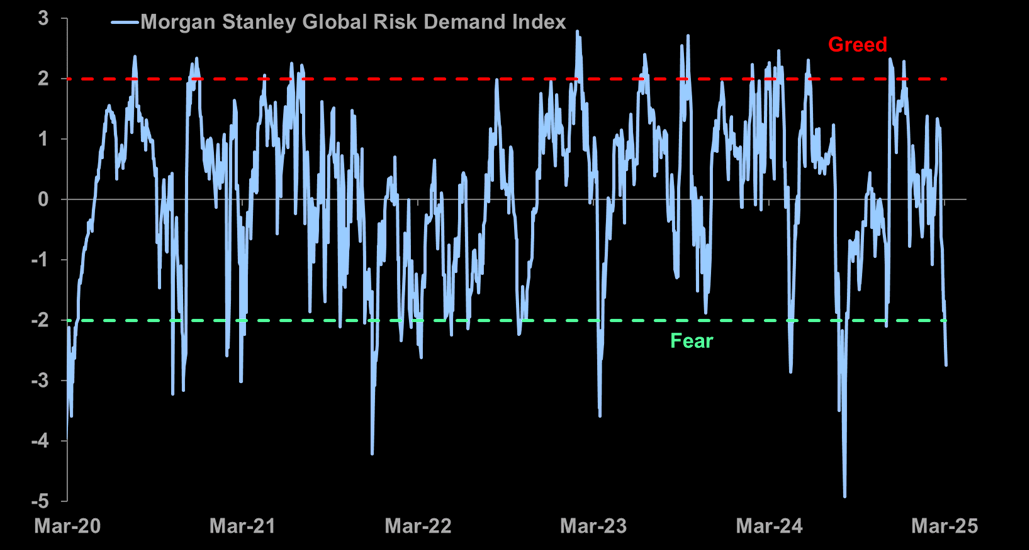
Source: Morgan Stanley
4 – Extreme pessimism
Over the past 30 years, this has been negative only 27% of the time, with SPX rallying 27.5% on average over following year.
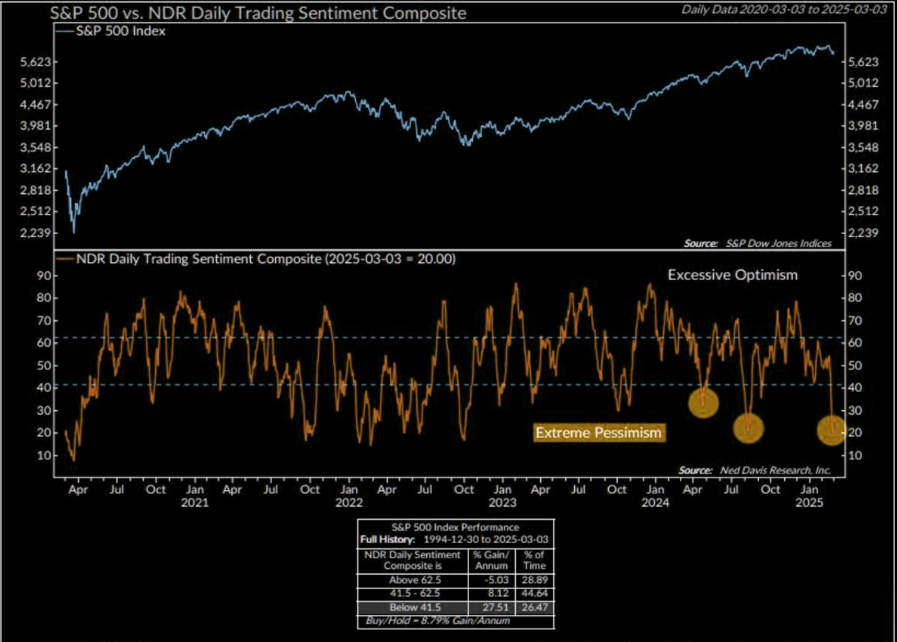
Source: @edclissold
5 – Previously a bottom
Third highest SPX put volumes session yesterday. GS points out that previous 2 spikes were bottoms for markets. QQQ put volume made a new ATH yesterday.
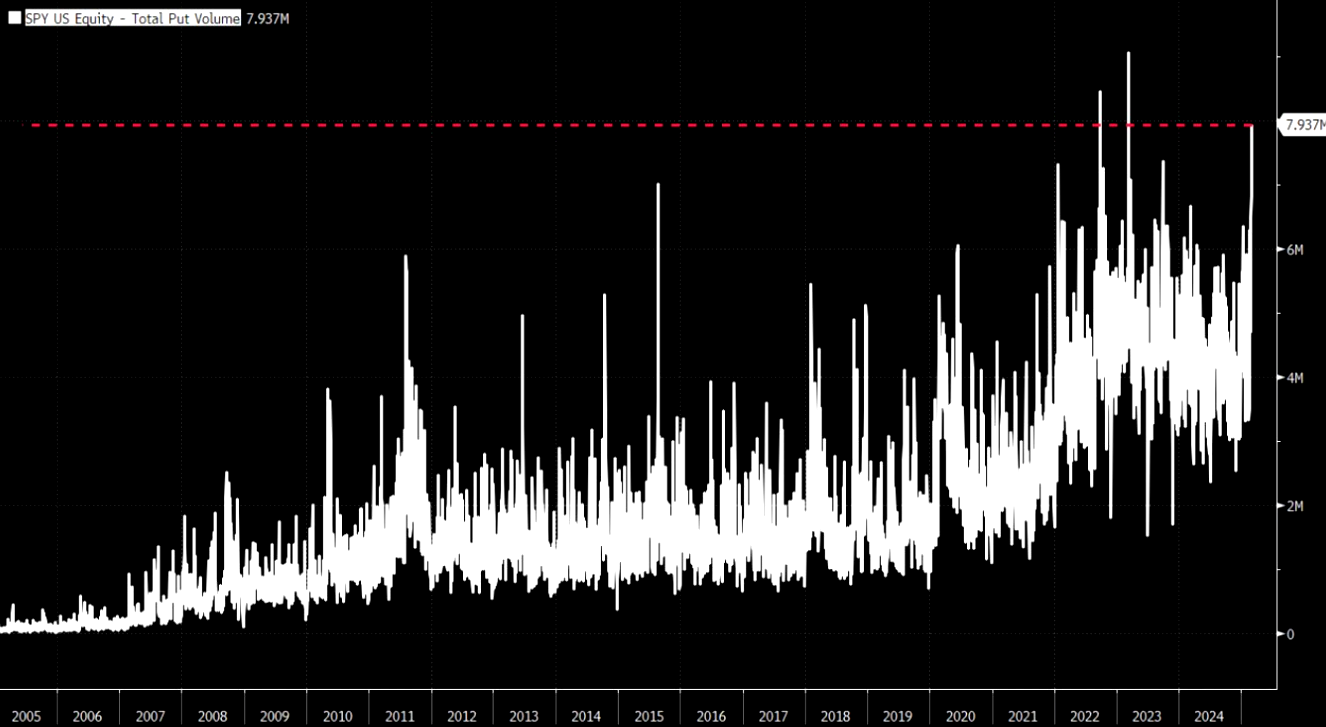
Source: GS/Bloomberg
But there is a “nasty” scenario…
“Mechanical” factors that matter
Markets have come down in a straight line basically since we pointed out that markets were about to roll over on February 21 (here and here). We did not anticipate the move would be this violent. The above factors all point to a short term bounce, but take this lower by another 2-3% and there are nasty “mechanical” risks to consider.
1 – Brutal intra-day
Intraday volatility is through the roof. Hedging mechanical flow is painful, and magnifies all moves. Do you hedge close to close, or panic during the day?
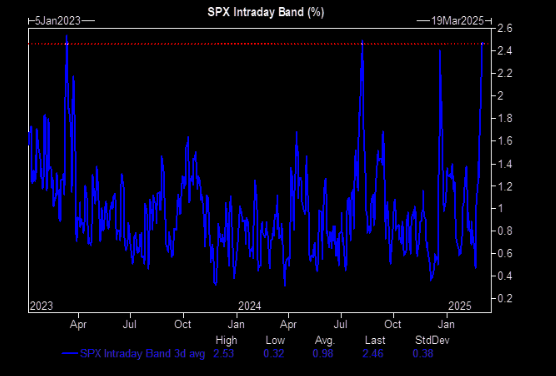
Source: GS
2 – Short gamma
Dealers are in short gamma. They continue to get whipsawed, both ways lately. SPX has moved some 140 points: down, up, down, up and down again over the past few sessions. This is a nightmare for short gamma.
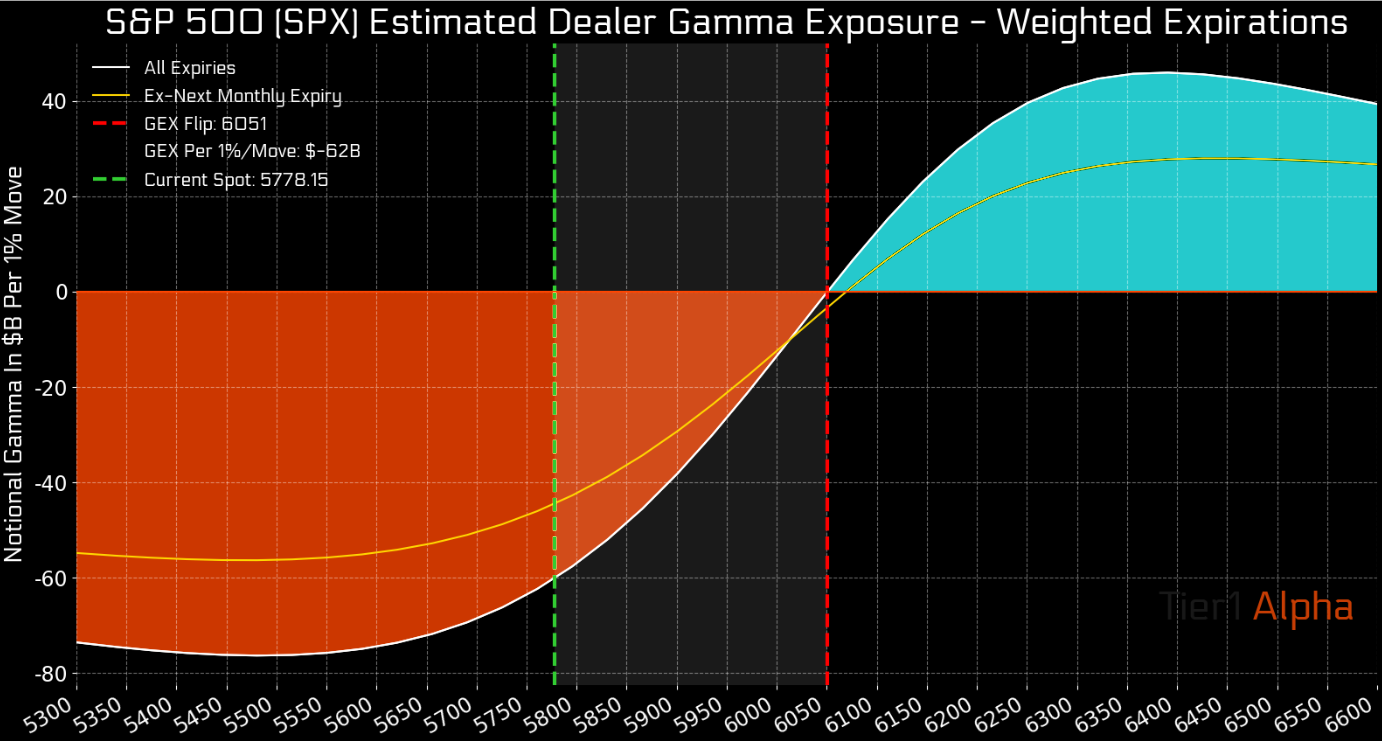
Source: Tier1Alpha
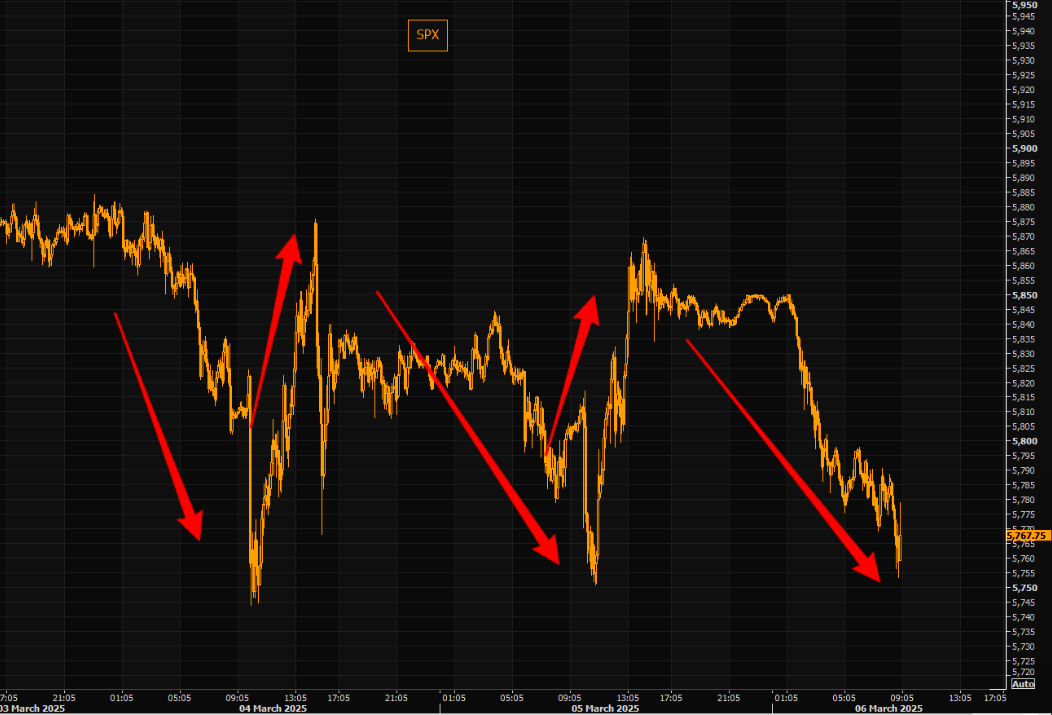
Source: Refinitiv
3 – Shitty liquidity
Good luck trying to reshuffle big books, and there are many that must reshuffle. GS sales with some color on poor liquidity: “Top of book liquidity started the year at $9.4mm, hit a high of $22.5mm in mid- january, and now sits at $4.4mm For context, the 1yr low for top of book liquidity was $2.8mm on August 5th.”
4 – Systematic supply – forced selling
“As the market continues to go lower and future forced systematic supply builds, many are asking how much more there is to go. Macro systematic length coming into Tuesday was in the 80th %ile versus the last 5 years, so the answer is a lot: at -2.2% in SPX QDS is forecasting nearly $100bn for sale over the next week. If leverage was to fall to the lows in Aug 2024 there would be an additional $100bn of supply ($200bn total). In a return to the leverage seen in the 2022 lows there would be an additional $150bn of supply on top of that ($350bn total).” (MS QDS)
5 – Trump put far down
McElligott’s view: The Trump administration may need an “engineered recession” to drive disinflation, justify Fed rate cuts, and weaken the USD for “phase 2” of its vision. A “negative wealth effect” from falling stocks and crypto could support this goal. Any “Trump Put” in equities is likely far OTM, not ATM. Markets are aggressively shorting, and no speech or statement can reverse sentiment unless Trump fully backs down on policy.