Retail’s all-in. Hedge funds are split. Systematic money just took $53B off the table. The Magnificent 7? Not so magnificent. Leverage? Sky high on one side, dead on the other. Welcome to the most confused market setup in years — where flows, fear, and FOMO are pulling in opposite directions. Everyone wants to be contrarian. But history says: you don’t get bull markets without bulls.

It takes bulls to have a bull market
Tons of focus on whether pessimism is widespread enough to support a sustained rally. Everyone wants to be a contrarian. Reality is that all of the net SPX gains over the past decade have come with the bull-bear spread >20.

Source: Willie Delwiche
There isn’t much cash on the sidelines
“$7t sounds like a lot of money, but must be viewed relative to the size of other asset classes.”

Source: Kantro
Magnificent lagging
The General of the (previous) bull market continues to be very tired. All 7 members of the Magnificent 7 are underperforming the S&P 500 this year, a 180 degree reversal from 2024…

Source: Bilello
Magnificent & AI selling
“AI Beneficiaries within the broader TMT universe have driven most of the net selling, with mega-cap Tech (and the Magnificent 7 in particular) accounting for most of this flow. In fact, the Magnificent 7 alone accounted for >60% of the total notional amount of what was sold over the past 3 trading sessions, causing net exposure to the group to fall to a near 2-year low.” (MS PB)
Hedge fund leverage: Still very bifurcated
US Fundamental Long/Short gross leverage rose by +2.8 percentage points to 205.4% — placing it in the 95th percentile over the past three years. Meanwhile, net leverage increased by +0.6 points to 45.8%, which remains near historic lows in the 2nd percentile of its three-year range. We continue to wonder if there can be a significant bottom without a major de-gross event.

Source: GS Prime
CTAs: At 1 out of 10 but no immediate massive buying
Goldman’s futures desk reports:
1. “We estimate that the systematic macro rebalance is now effectively complete, with global equity exposure dropping from approximately 8 out of 10 at the YTD/February highs to 1 out of 10 currently—equivalent to around $53 billion in de-risking. This shift reflects a short positioning from CTAs/trend followers and 1-year low exposure from risk parity and vol-control strategies.
2. From here, the baseline positioning is relatively neutral to slightly long. Any meaningful buying from these players is likely conditional—either on further market upside, accompanying flows, or simply more time passing.”

Source: Goldman
Bro bid: You don’t see this at bottoms
Impressive inflow to leveraged global equity funds. Leveraged Long ETFs saw a weekly inflow of $6.6 Billion last week, the most in history. Something you never see at market bottoms: retail investors piling into leveraged long ETFs.

Source: BofA
More on the Bro Bid
Individual investors continued to buy single stocks last week. Buying in NDX and SPX names on Thursday was most notable.

Source: Goldman
Things that would support a bull
Long/short ratio: Very low
The US Fundamental Long/Short ratio (market value) held steady at 1.574, remaining at the 1st percentile of its three-year range.

Source: GS Prime
The TPM remains quite low
The TPM remains quite low across metrics—the 1 week change is -1.7z, the 4 week change is -1.5z (and -1.4z on 3d average), and the level remains at -0.9z or the 12th %-tile since 2015.

Source: JPM PI
Death cross: Actually more likely for a NT bounce than calamity
“The other major price action event of the week was the SPX marking a death cross on Monday, when the 50DMA sunk below the 200DMA for the first time since ’22. We looked at the historical performance following such events going back to 1970 to get a clearer picture of what this means. While a death cross necessarily happens after a steep drop for the SPX (ST price action worse than LT price action) it doesn’t necessarily mean future returns are dead. Shown in the chart below (using a log scale) death crosses happen both at market ‘tops’ as well as ‘middles’. There are plenty examples of brief pauses with rallies continuing. And the performance data backs this up. We found that it is actually more likely for a NT bounce than calamity after a death cross, as 6mo performance averages over 7%.”

Source: Jefferies

Source: Jefferies
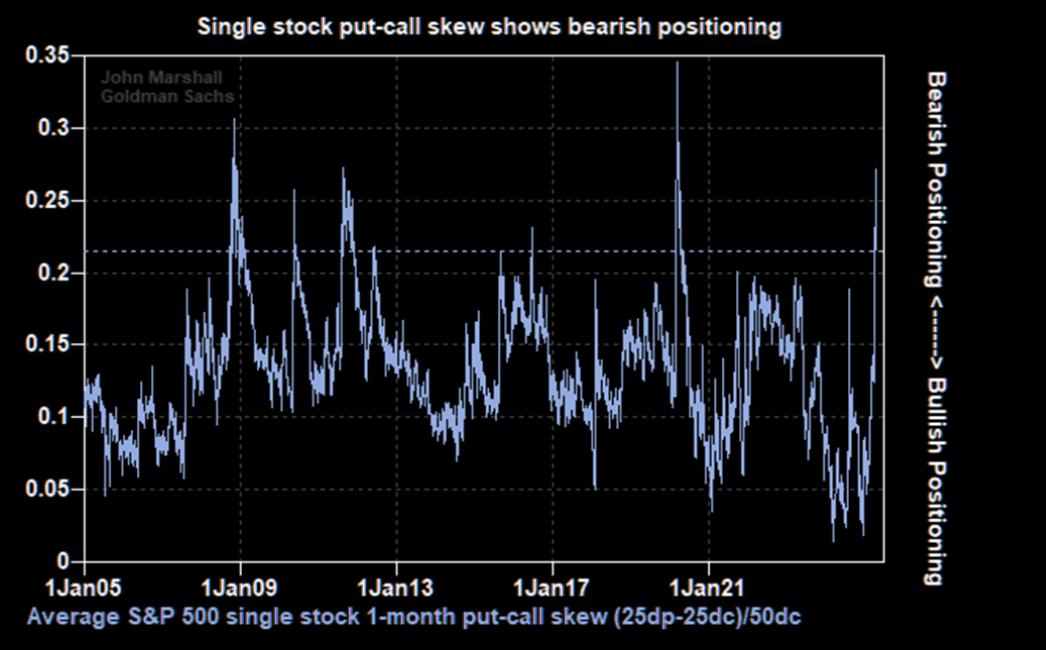
Investors are still positioned for downside asymmetry in stocks
GS: “We continue to see fear levels as extreme relative to the current environment where catalysts for upside asymmetry are more likely than downside.”