Få fri adgang til alle lukkede artikler på ugebrev.dk hele sommerferien:
Tilmeld dig tre udgaver gratis af aktieanalysepublikationen ØU Formue, der udkommer igen til august
Uddrag fra Goldman Sachs:
After banks dominated earnings last week, attention now shifts to the tech giants as the first Mag7s report on Wednesday, when we get Q2 reports from GOOGL and TSLA, and also hear from IBM, Texas Instruments, and others this week.
What to expect?
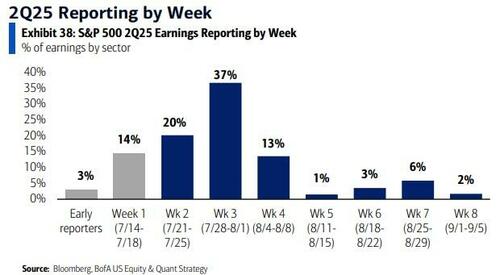
Before we get there, first some background: the S&P 500 has rallied by 26% since April-lows primarily driven by Tech stocks (XLK +44%), and 50% of stocks by weight in the XLK will report in the next two weeks; 53% of S&P 500 stocks in Info Tech and 82% of S&P 500 stocks in Communication Services also report in the next two weeks. Here is the total reporting breakdown by week for the S&P.
But unlike previous quarters, there is an almost eerie complacency as to what tech companies will report. As the next chart from Goldman shows, the average tech stock in the S&P 500 is implying an earnings-day-move of 4.7%, the lowest in two decades! This should serve as a very loud warning, because when Wall Street gets extremely complacent, that’s when things blow up.

One more thing, and this goes to the record concentration of tech: as Goldman’s Peter Callahan writes, the US Info Tech sector now accounts for ~34% of the S&P 500, as measured by market cap, matching the record weight that the sector enjoyed back in ‘99/’00 (chart below). In total, the subsector boasts a market cap of ~$18.5trn – this subsector market cap size alone is larger than the entire market cap of every country outside of the U.S.


Next, let’s take a closer look at the key things investors should be on the lookout for once tech earnings begin, courtesy of Goldman’s tech traders Peter Bartlett and Peter Callahan.
- Semis: Most crowded pocket of TMT – if not the market – right now as the group remains the cleanest expression of growing AI enthusiasm (where sentiment seems to make new highs daily). Despite being well-held by most investor types (Long Onlies, HFs, Households/Retail etc) Goldman continues to see Generalist inflows into this group on the bank’s desk, without much evidence of that bid slowing.
- Internet: Quite crowded group, which boasts some notable YTD winners. investors now have to balance rich valuations vs. strong “intact” long-term stories.
- Software: While there are some exceptions at the top of the house (most notably: MSFT / ORCL), sentiment around Software broadly, as a sector, continues to downtick, largely as uncertainty persists around the long-term impact of AI on enterprise/cloud software businesses.
- Telco/Media: there are pockets of Telco/Media which have garnered a fair amount of length and investor interest this year. Names like DIS, T, FWONK, WBD, FOXA, TKO, and LYV frequently come up as new Long Pitches, and we sense increased length, particularly from the HF crowd.
- IT Services/Agencies: mostly negative
What are the most concentrated Mega Cap Stocks (positioning scale 10=max long, 1=max short):
- NVDA (10): After a rocky start to the year, NVDA is now up over 90% from the early April low tick, is +25% on the year, sports a $4T market cap, seemingly benefits from a new positive industry datapoint daily, and is back to being universally loved. Desk flows continue to skew constructive, with a steady stream of Global/Generalist inflows underpinning the recent breakout to new highs. Expectations are for another beat / raise quarter when they report in late Aug.
- MSFT (9): Microsoft has firmly broken out of its 18month holding pattern, adding $650bn (or one “Visa”) to its cap (which now stands just shy of $4T) this year. Well positioned to capture a number of major secular trends (gen AI, public cloud consumption, SaaS adoption etc) + relatively insulated from tariff considerations, MSFT has become an “easy” core long for most Growth, TMT, & Generalist portfolios. Bulls are playing for mid-30s+ Azure Growth in the quarter.
- META (8.5): While still well-owned by most measures and sentiment still largely positive, there has been a slight uptick in caution in recent weeks. Strength still expected in the quarter and guide, as the Ad environment remains strong (and benefiting from AI efficiency), but some longer term uncertainties are emerging given recent moves (hiring spree / off-balance sheet datacenter investments are bringing the ROI discussion back into the fold). For the print, bulls are looking for robust top line performance in the quarter & guide to support growing spending trends.
- AMZN (8): A relative laggard on the year (“only” +3% ytd), AMZN has had to contend with tariff uncertainties (which have abated in recent weeks) + some technical/flow headwinds (Bezos Form 4s) + debates on AWS growth into the second half. Still a Long for most, but we sense some 2-way tactical positioning.
- AVGO (8): While below NVDA in most investors’ pecking order, Broadcom is still quite a popular thematic long, with not much of a debate on the fundamental story, beyond valuation.
- GOOGL (6.5): We’ve sensed and saw a fair amount of length shaken out over the course of this year (particular around a handful of “AI” scares). At this point, GOOGL feels like a fairly material underweight for both the LO and Long/Short communities. The consensus view is we get a “beat & fade” reaction, with the looming DOJ ruling in August representing a potential limiter to price action post print.
- AAPL (4): AAPL a very clear outlier from a sentiment, flow, and positioning perspective relative to Supercap Tech peers. As the largest Mutual Fund Underweight in the market and a popular HF relative short, AAPL has represented a significant source of “performance Alpha” for most this year (stock -17% vs. NDX +9%). A beat is expected in the quarter (and most are “respectful” of that dynamic), but long term uncertainties around AAPL’s competitive positioning feel like they remain as high as ever.
- TSLA (3). Already know the 1Q delivery number, which was reported at 384K to start July (better than expected). Goldman thinks they are expected to revise down the FY guide and will move away from the prior guide for deliveries to “grow” in 2025. Most see modest risk to the gross margin consensus of 16.6%, given view that better deliveries may have come at the expense of margins. Short interest is still elevated and is 80M, about where it was into last quarter. Still expect trading to be dominated by the Retail community, and think institutions are slightly short.
A closer look at Semis…
GS Prime highlights a multi-year increase in HF L/S Ratio across Semis and Semi Equipment.

Notable to see the current L/S ratio is at the highs (consistent with market sentiment around the group).
- Most Popular Longs/Overweights: NVDA, AVGO, TSM, MU, TXN, ADI, MCHP
- Most Popular Shorts/Underweights: INTC, ON, QCOM, SWKS, QRVO, GFS
…and Software
Software feels like it is the flip-side of the Semis coin (and we’ve noticed increased negative-correlation days between these 2 subsectors in recent weeks & months).

GS Prime highlights a multi-year decrease in Software L/S ratio, with the current reading at the lows (also consistent with market sentiment).
- Most Popular Longs/Overweights: MSFT, SNOW, ORCL, NOW, CRWD
- Most Popular Shorts/Underweights: ADBE, WDAY, TEAM, PAYC, MNDY
Internet…
GS Prime highlights a L/S ratio across Internet that is high on an absolute basis (~4.5x) but middle of its recent range.

- Most Popular Longs/Overweights: META, SPOT, NFLX, AMZN, TTWO
- Most Popular Shorts/Underweights: SNAP, ETSY, RDDT, EXPE, LYFT
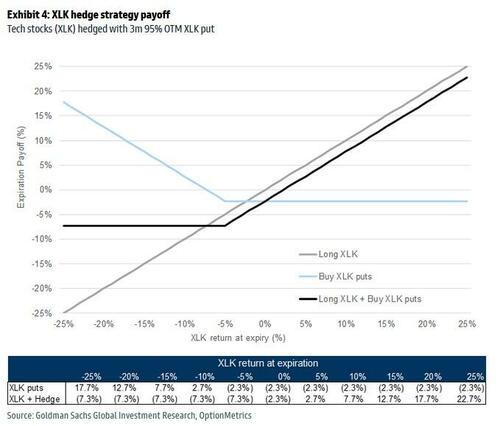
Finally, given that gross hedge fund leverage is near multi-year highs and Mag7 names now make up ~16.5% of total US net exposure, Goldman recently put together a playbook on how to hedge your tech exposure, which we summarized in “It Hasn’t Been This Cheap To Hedge Tech Earnings In 20 Years“, or the original “Hedging Tech” report which can be found here for pro subs, but here is the punchline:
Buy S&P Technology (XLK) 3-month 5% OTM puts
With investors increasingly concerned around the recent momentum unwind, we suggest investors to hedge their tech exposure. Over the past year, Tech stocks (XLK) have shown a 92% correlation with the momentum factor (MTUM). For investors concerned about momentum & earnings revision risks, we recommend hedging tech exposure with XLK puts or buying puts on stocks with high earnings revision risk. XLK 3m puts would capture the upcoming Tech earnings releases, FOMC meetings 7/30 & 9/17), policy announcements and multiple data releases. Put buyers risk losing their premium paid if shares close above the strike price at expiration.