Få fri adgang til alle lukkede artikler på ugebrev.dk hele sommerferien:
Tilmeld dig tre udgaver gratis af aktieanalysepublikationen ØU Formue, kampagne udløber snart
Uddrag fra Goldman
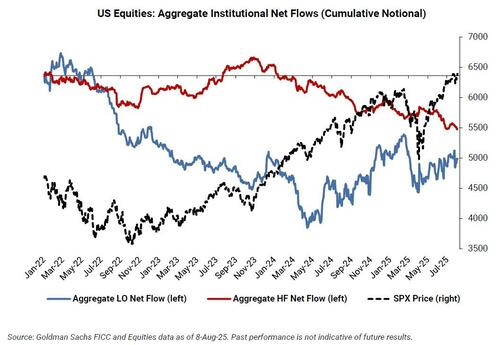
As Goldman trader Matthew Kaplan writes, in a week which saw the S&P rise 2.5%, closing right at the ATH, Long Only funds finished +$4BN net buyers while hedge funds skewed -$1BN net sellers (much more on this below) as the market navigated a very challenging earnings season and dispersion under the hood. According to the Goldman Shares Sales trading desk, the Largest Buy Skews were in Healthcare, Tech, and Industrials, while the Largest Sell Skews: Financials & Macro Products.
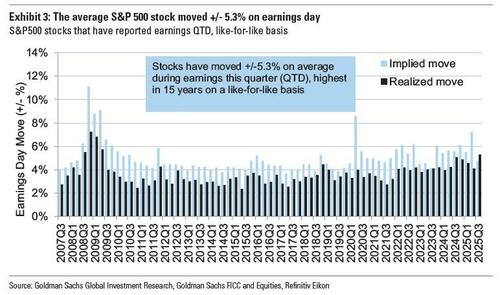
On the earnings front, 60% of companies have beat EPS by more than 1 st dev (vs historical 48%), and 9% have missed. Earnings-day moves have been bigger than options investor expectations this quarter for the first time Goldman’s 18-years of tracking implied moves. The average S&P 500 stock moved +/-5.3% (15-yr highs), higher than the options implied move of +/-4.7% (2-yr lows), on a like-for-like basis.
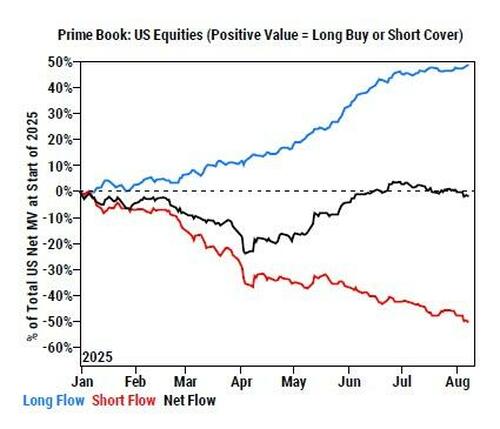
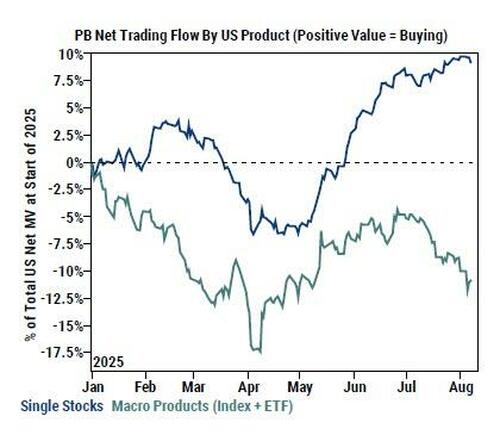
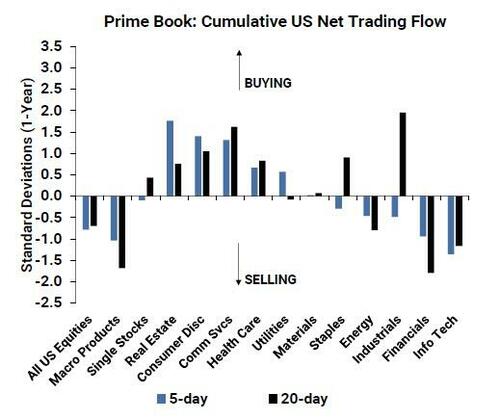
Taking a closer look at the latest hedge fund moves, Goldman’s Prime Brokerage writes that last week, hedge fund net sold US equities at the fastest pace in 4 months, driven by short sales outpacing long buys ~3.5 to 1… Some more details:
- Macro Products (Index and ETF combined) made up over 90% of the total $ net selling (-1.0 SDs), driven by short sales and to a lesser extent long sales (~4 to 1). US-listed ETF shorts increased +4% (now up +5.7% month/month), led by shorting in Corporate Bond, Large Cap Equity and Info Tech ETFs.
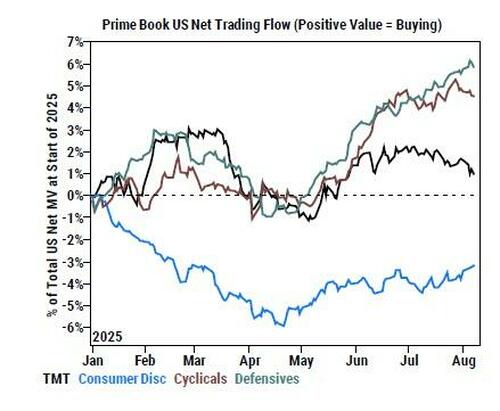
- Single Stocks collectively were modestly net sold for the first time in 4 weeks (-0.1 SDs), driven by risk-on flows with short sales slightly outpacing long buys. Info Tech, Financials, Industrials, and Energy were the most notionally net sold sectors, while Cons Disc, Comm Svcs, Health Care, and Real Estate were the most net bought.
- HFs net sold US Info Tech stocks for a third straight week and at the fastest pace in over 4 months, driven by short-and-long sales (3.9 to 1). All subsectors were net sold, led by Tech Hardware, Software, and Semis & Semi Equip. Info Tech now makes up 19.2%/16.4% of total US Gross/Net Exposure on the Prime book, in the 71st/11th percentiles vs. the past five years.
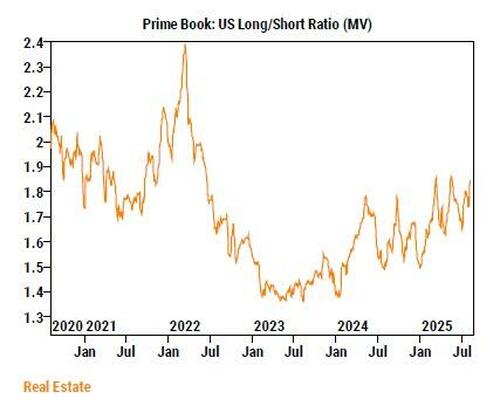
- US Real Estate stocks saw the largest net buying in 3.5 months, driven entirely by long buys, and have now been net bought in 4 the last 5 weeks.
- Most subsectors were net bought, led by Residential REITs, Real Estate Mgmt & Development, Office REITs, and Health Care REITs. US Real Estate long/short ratio now stands at 1.84, in the 96th percentile vs. the past year and in the 72nd percentile vs. the past five years.
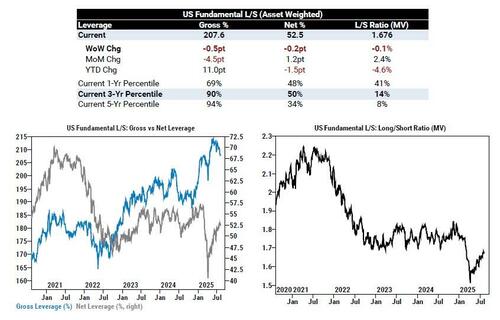
Taking a step back, the bigger picture is as follows: Fundamental L/S Gross leverage fell for a fifth straight week by -0.5 pts to 207.6% (90th percentile 3-year), and US Fundamental L/S Net leverage fell -0.2 pts to 52.5% (50th percentile 3-year). US Fundamental long/short ratio (MV) was relatively unchanged at 1.676 (14th percentile three-year).
Whereas in previous weeks any lack of euphoria by the hedge fund community was more than offset by frenzied retail buying, that too was missing last week. According to the latest JPMorgan Retail Radar report (available to pro subs), retail net bought $4.9B over the past week, well below the $6.6B YTD weekly average and $5.6B 12m weekly average.
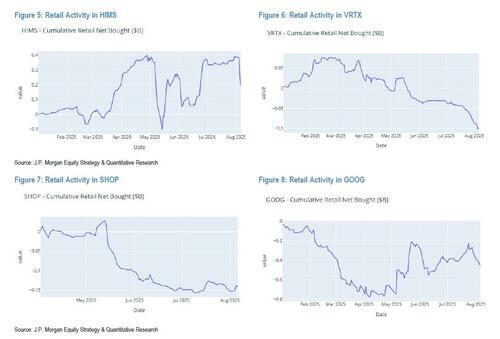
JPM notes while activity is still subdued when compared to March and April – despite recent market action – the bank saw small pockets of interesting activity around earnings, with retails “buying-the-AMZN-dip” post their earnings announcements on July 31st and adding to PLTR, while they sold GOOG and HIMS.
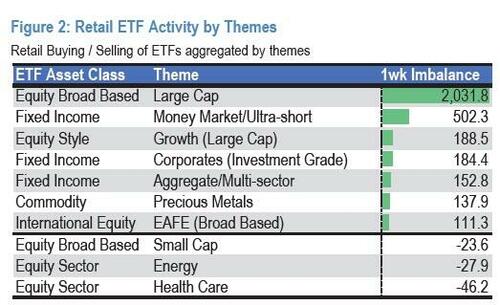
Unlike hedge funds, which focus their bearish bets on macro/ETFs, retail investors were a mirror image as they continued to favor ETFs ($4.7B) over Single Stocks (+$276Mn). Most of the buying was concentrated in Large Caps ETFs (+$2.2B), followed by Money Market (+$535Mn) and Large Cap Growth (+$209Mn). Health Care (-$50Mn), Energy (-$35Mn) and Small Caps ETFs (-$24Mn) were net sold.
Largest ETFs inflows were in QQQ (+$724Mn), SPY (+$715Mn), VOO (+$408Mn), SGOV (+$282Mn), BIL (+$162Mn) while the most sold ETFs were SOXL (-$126Mn), SQQQ (-$77Mn), IWM (-$28Mn), RWM (-$24Mn), SPXL (-$23Mn)
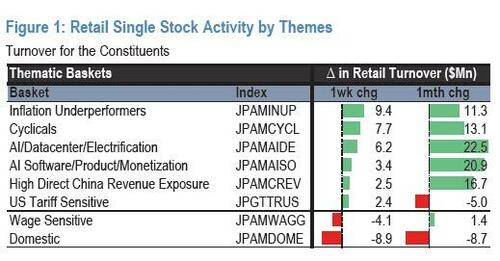
Within single stocks, retail investors favored stocks linked to inflation underperformers, cyclicals and AI.
Among sectors, Cons. Disc. was bought (+$306Mn, +1.4z) along with Communications (+$95Mn, +0.7z) and Tech ($57Mn), against Financials (-$373Mn, 0.2z), Health Care (-$166Mn, -0.5z) and Industrials (-$99Mn, -0.6z).
- They were net single stocks buyers (+$276Mn); the main contributors were NVDA (+$453Mn, +0.0z), AMZN ($453Mn, +0.8z) and PLTR ($253Mn, +0.1z).
- Conversely, retail sold TSLA (-$260Mn, -0.4z), HIMS (-$202Mn, -2.6z – the bulk of the selling taking place on Tuesday
5th, in a 4.9z selling spree spurred by the company missing revenue estimates) and GOOG (-$106Mn, -0.9z).
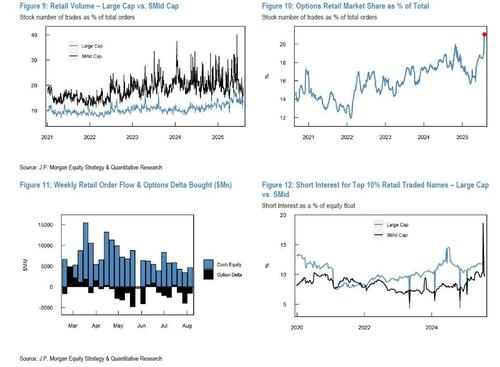
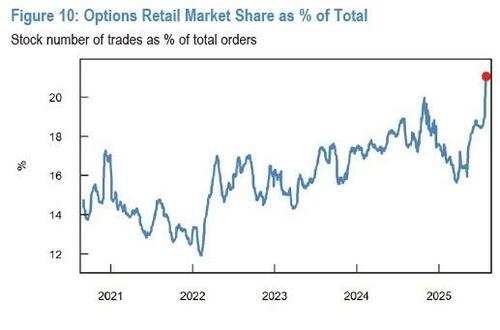
While retail activity in stocks was subdued, trading in options remained elevated with retail traders net selling $1.5B of delta and $42B of gamma – down from one of the largest weekly gamma supplies last week.
Of the charts above, we highlight the most important one:
Lukewarm Retail Activity During the Market Dip
Zooming into last Friday’s market action and subsequent recovery, retail buying only amounted to a modest +$1.6B on Friday Aug 1st and +$1.2B on Monday Aug 4th, compared to a 3m avg of +$1.0B and a March/April daily peak of ~$4.7B. More precisely, on Friday, Aug 1st:
- Retail net bought +$1.6B, of which $1.2B in ETFs and +$376Mn in singles.
- Retail bought AMZN ($230Mn – “buy-the-dip” following earnings, +2.0z day), NVDA ($120Mn, +0.1z) and AAPL ($111B, +1.5z) and sold GOOG (-$27Mn, -0.7z), META (-$24Mn, -0.7z) and HOOD (-$23Mn, -1.0z).
As equity markets rebounded on Monday, Aug 4th:
- Retails net bought +$1.2B, of which +$1.0B in ETFs and +$248Mn in singles.
- Retails continued to buy AMZN ($114Mn, +0.7z), NVDA ($95Mn, +0.1z) and PLTR (+$84B, +0.3z) ahead of their stellar earnings announcement post close, while they continued to sell GOOG (-$29Mn, -0.7z), as well as companies announcing earnings (e.g. IDXX: -$27Mn, -7.3z).
Before we look at the week ahead, we go back to Goldman’s trading desk, which shares the following Mark-to-Market report on each sector, from the bank’s Trading & Sector Specialists:
- Tech: Markets finishing another week higher with NDX +3% and SPX +1.5%, as the start of ‘August trading’ brought a long tail of EPS prints and definitively choppy single-stock price action. The datapoints from earnings we got this week continue to remind us that implied earnings-day moves have understated the reality this quarter, and that the bar to sustain a beat is high. Top two focuses into the latter half of the week have been: 1) AAPL’s remarkable 3-day run (+12% since Weds) as tariff relief and underweight positioning combine to fuel a move higher and 2) extreme weakness in Software as seemingly solid prints seeing their initially positive moves faded to negative bring R/R debate into frame (+ OpenAI’s GPT 5 launch causing further anxiety)
- Consumer: Price reactions in consumer to results were very weak. What’s interesting is the price action was pretty week, whether results were good, or bad. If your results were bad, you were punished hard (CROX, UAA, YETI etc). If they were good, stocks generally faded as well (SN, RL, WRBY, EL, DKNG). For those stocks that did hold on T+0, there has generally been some level of give back post opening highs and on T+1 to T+4 (BROS, WING, PEP, DECK, etc.). Why the weak price action? Feels like a rotation into housing, TMT and also just general consumer concerns, post weak results in restaurants and hotels.
- Industrials: up close to 100bps this week but meaningfully underperformed the broader markets which historically is the trend in August. Housing led on the week as investors contemplated a more dovish Fed coupled with better-than-expected earnings across the group. That leads to the largest gainer on the week IBP with a strong beat and raise and saw intense short covering +23%. Other small cap earnings helped support PRIM +22%, TPC +22%, AXL +20% and another housing name WMS +17%. On the downside ATKR was off 28% on earnings with a CEO succession. GT KMT ULCC MIDD ESAB were also down sharply on earnings as well. Volatility during earnings season was much higher than expected and much higher than historically. Next week conference season will pick up and macro data points in focus as earnings wind down and summer doldrums kick in.
- Energy: Key area of focus this week for Energy complex centered around IPP earnings, with VST, CEG, TLN and NRG all reporting EPS. The bar was high into the prints on expectations for talking to more potential deals with hyper scalers and clarity on pricing. Px action was dispersed across the group, with NRG reporting 295 MW of additional data center deals yet the stock finishing down double digits. For VST, the bar was elevated on a CP deal announcement, which did not materialize, though color was provided on the Q&A highlighting good progress on this deal and others (stock finished positive on the day). From here, we still believe investor interest in the space remains elevated, though expect more debate around valuation on go forward.
- Financials: With earnings behind us, starting to head into the ‘catalyst light’ part of August and the different debates/focuses across subsectors are as follows: 1) Banks continue to serve as a source of funds amidst broader market derisking (as across fins, banks had some relative length in positioning) while within banks, the focus is on each banks’ rate sensitivity profile given we’re potentially re-entering a rate cutting regime, 2) The debate in generally ‘sleepy’ business service stocks continues around stocks ‘at-risk’ of disintermediation from AI, and conversations are increasingly narrowing on businesses that don’t own proprietary datasets, 3) The big news in Payments was the Fed could now proceed with a 2023 proposal to lower debit interchange rates; initially, anyone with exposure to debit payment volumes underperformed as there was a lot of confusion as to who was impacted, on which we’d note a) V & MA don’t charge interchange and there is no direct impact on them, b) COF is exempt from Durbin and also has no impact, c) the impact is felt by banks (who have limited recourse to the networks), which GIR previously estimated a 1-3% EPS impact, and d) merchant acquirers are potential beneficiaries (particularly small business acquirers that charge bundled pricing like TOST/XYZ).
- Real Estate only slightly outperformed the S&P, as the 10yr partially retraced some of last month’s move and earnings wrapped up. Overall, the most enthusiasm in Real Estate conversations is around the CRE brokers, given July data showing CRE transaction activity is shaping up to be +15-30% YoY, while earnings from all 6 brokers were particularly robust. (TY Christian DeGrasse)
We conclude with an advance look at what to expect in the coming week, where focus will be on macro data (CPI Tues, PPI Thurs, and Retail Sales Fri), as well as an expected 90-day extension to the US-China trade deal (deadline is Tues). Largely at the tail of earnings season (only 1% of S&P mkt cap set to report), namely DE, CSCO, AMAT, AMCR, TPR, CAH, HRB, EAT, AAP. The implied S&P move through next Friday (8/15) is just 1.25%.
Intro-pris i 3 måneder
Få unik indsigt i de vigtigste erhvervsbegivenheder og dybdegående analyser, så du som investor, rådgiver og topleder kan handle proaktivt og kapitalisere på ændringer.
- Fuld adgang til ugebrev.dk
- Nyhedsmails med daglige opdateringer
- Ingen binding
199 kr./måned
Normalpris 349 kr./måned
199 kr./md. de første tre måneder,
herefter 349 kr./md.
Allerede abonnent? Log ind her


