| Nothing’s broken… but it’s no longer clean | | Markets are losing their clean look. The biggest driver of the rally, semis, is finally showing signs of stress after a historic run, while oil continues to grind higher and macro volatility remains oddly subdued. Under the surface, the setup is getting more complex. Momentum is still there, but dispersion is rising, tails are mispriced, and key assets are no longer moving in sync. |
|
| SOX gapping down | | SOX gapped lower today, down over 3% as of writing, leaving the recent two candles isolated at all-time highs. We outlined yesterday why the move looked stretched: a pullback toward the 21-day MA would do little damage to the broader structure. Notably, price briefly pushed above the upper trend line but has since moved back below it. | 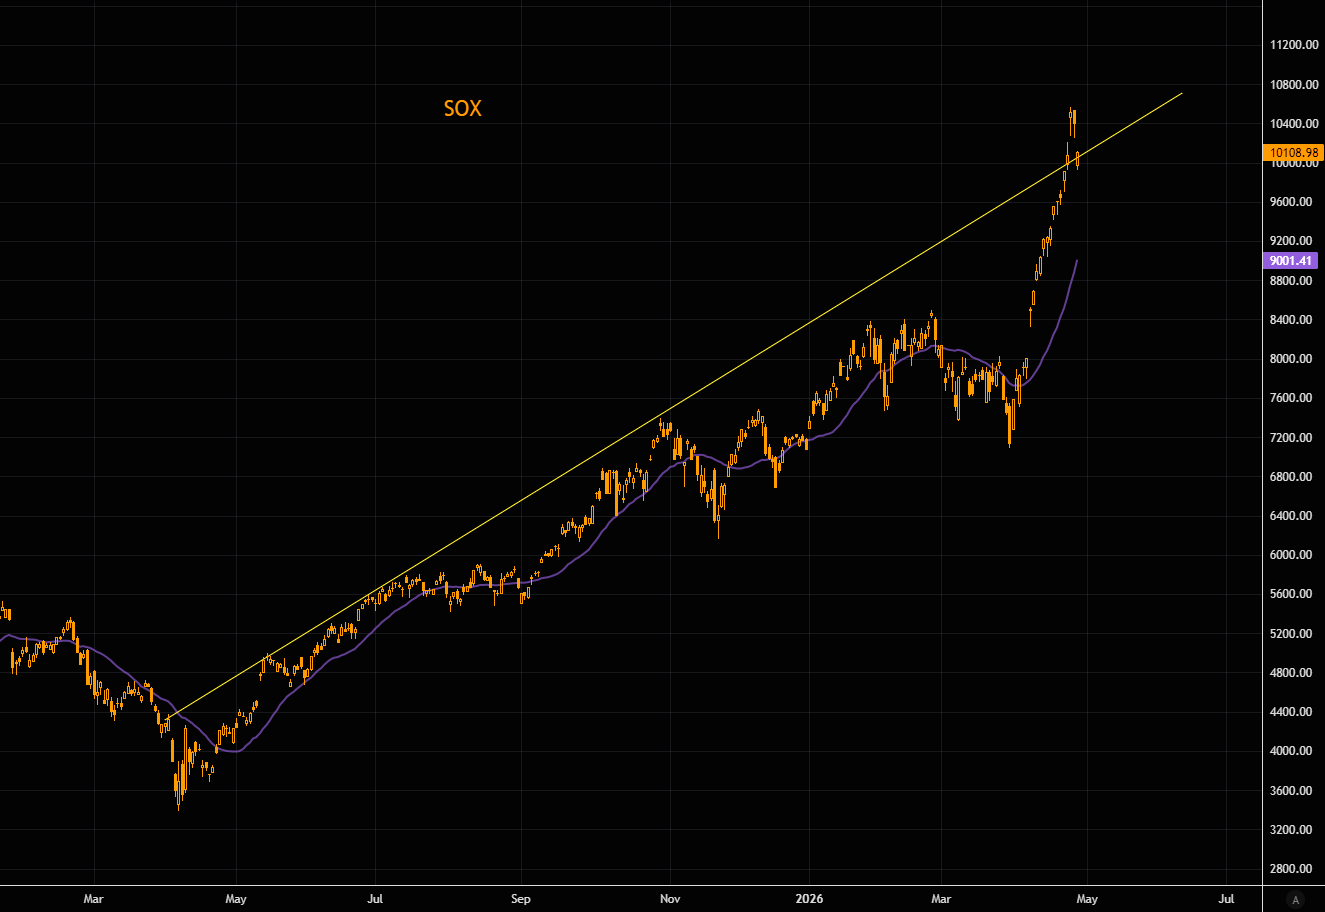 LSEG Workspace LSEG Workspace |
|
| Record superlatives | | Heading into the latest pullback, SOX had just completed a record winning streak—the longest in its 30+ year history. | 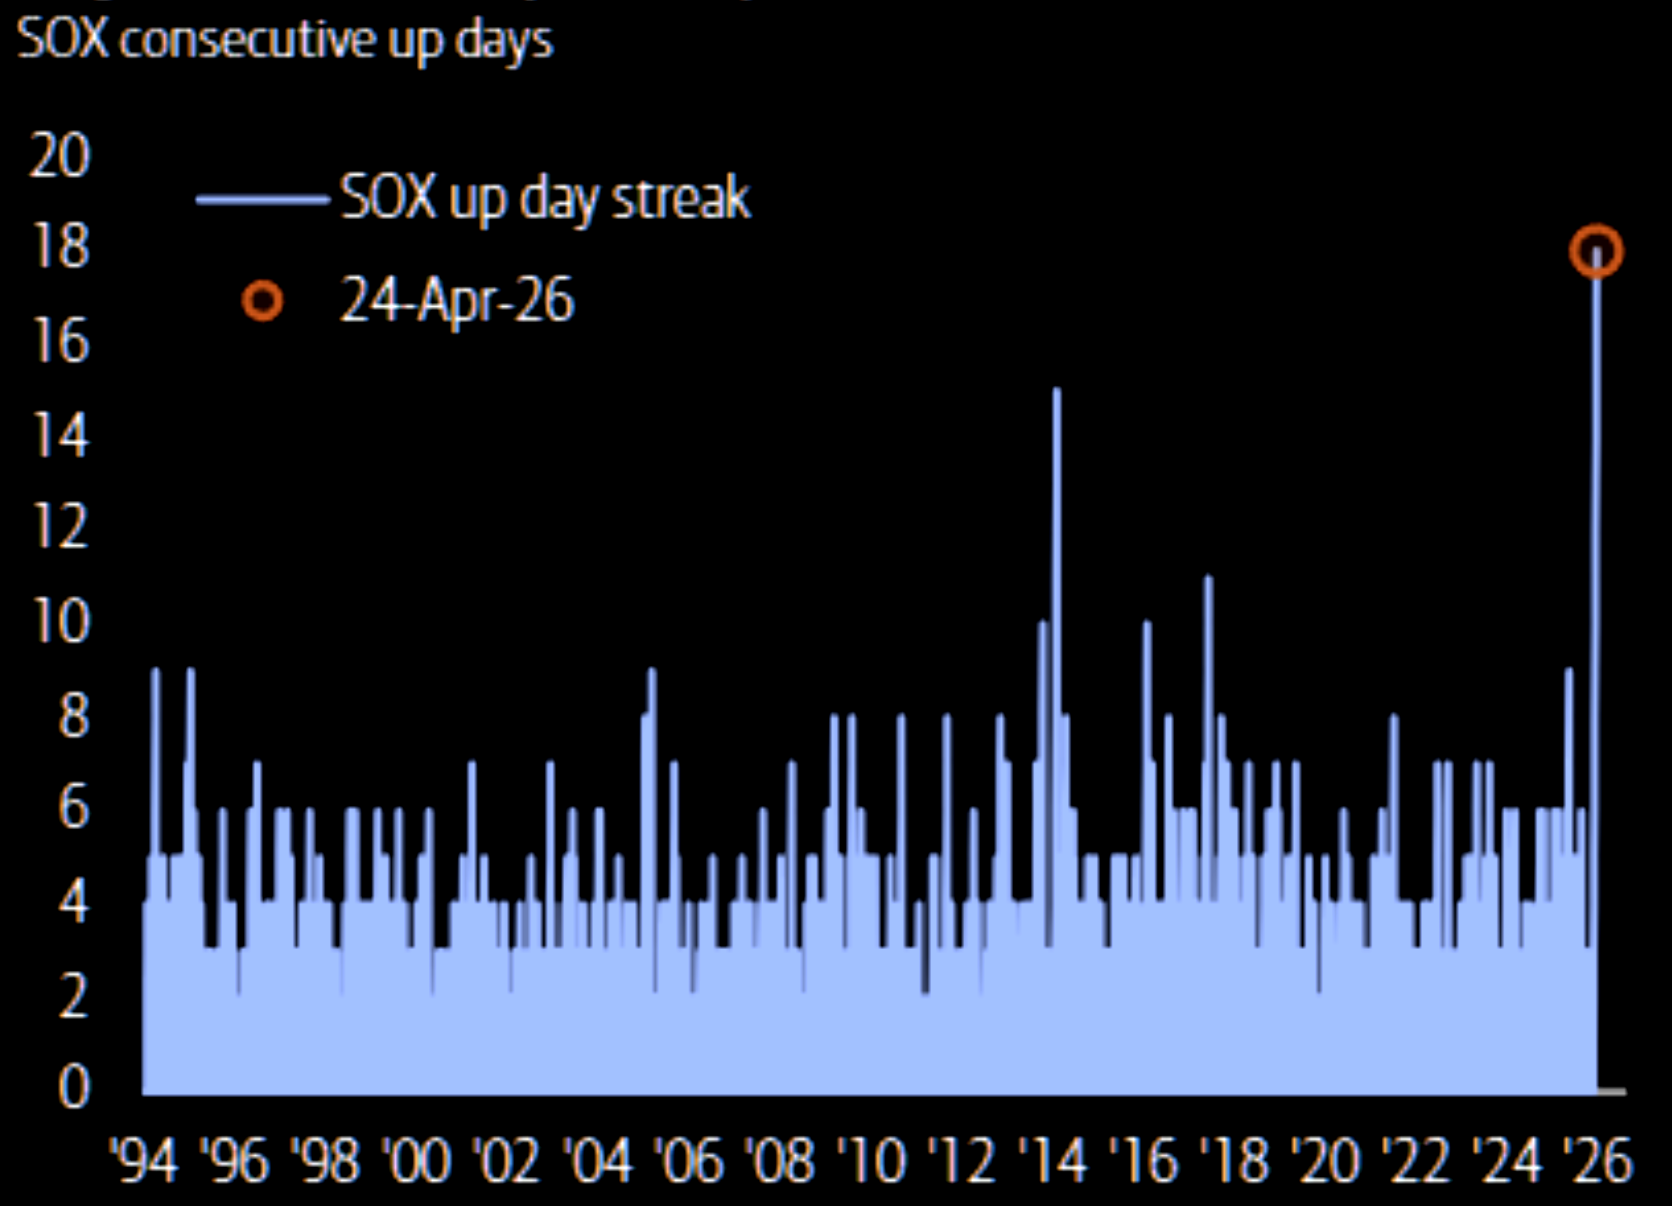 BofA BofA |
|
| Bubble SOX | | BofA’s great derivs team writes that the combination of high momentum and high volatility price action is starting to resemble bubble-like dynamics. BofA’s Bubble Risk Indicator for SOX has jumped into the top quintile, reaching ChatGPT-era highs and signaling increased near-term risk in both tails. As seen earlier this year in the Kospi, gold, and silver, options asymmetry becomes critical in this type of environment, either protecting longs via put spreads or replacing exposure with call spreads. | 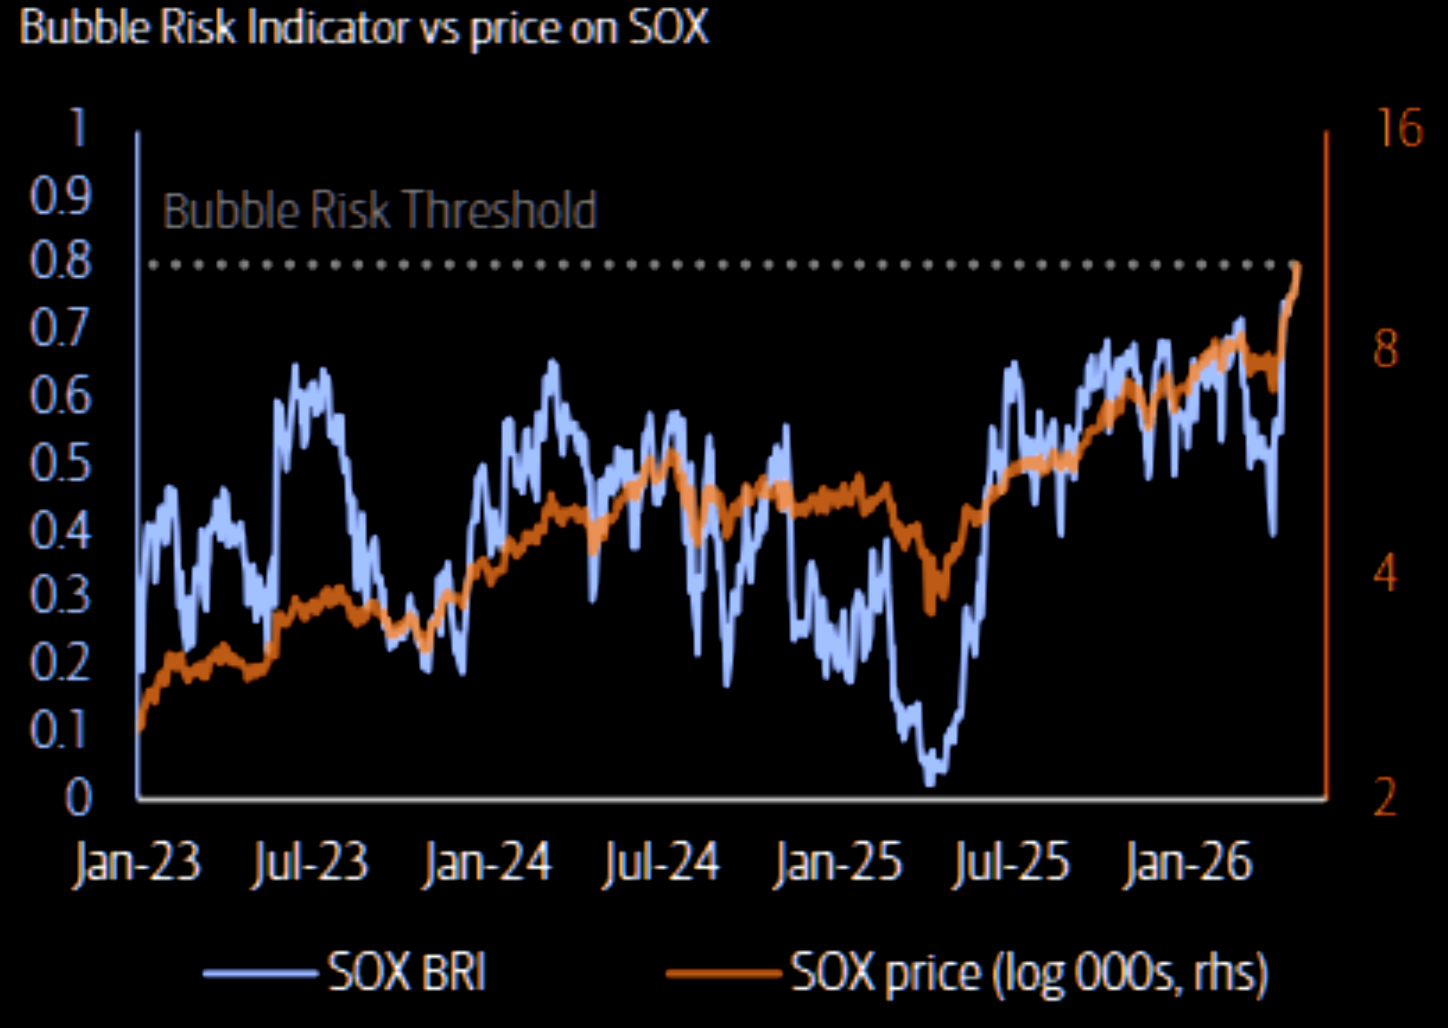 BofA BofA |
|
| Broad bubble | | With almost half of SOX names showing BRIs above 0.8 and two-thirds above 0.7, the instability in US semis looks broad and structural… not just a few crowded trades. | 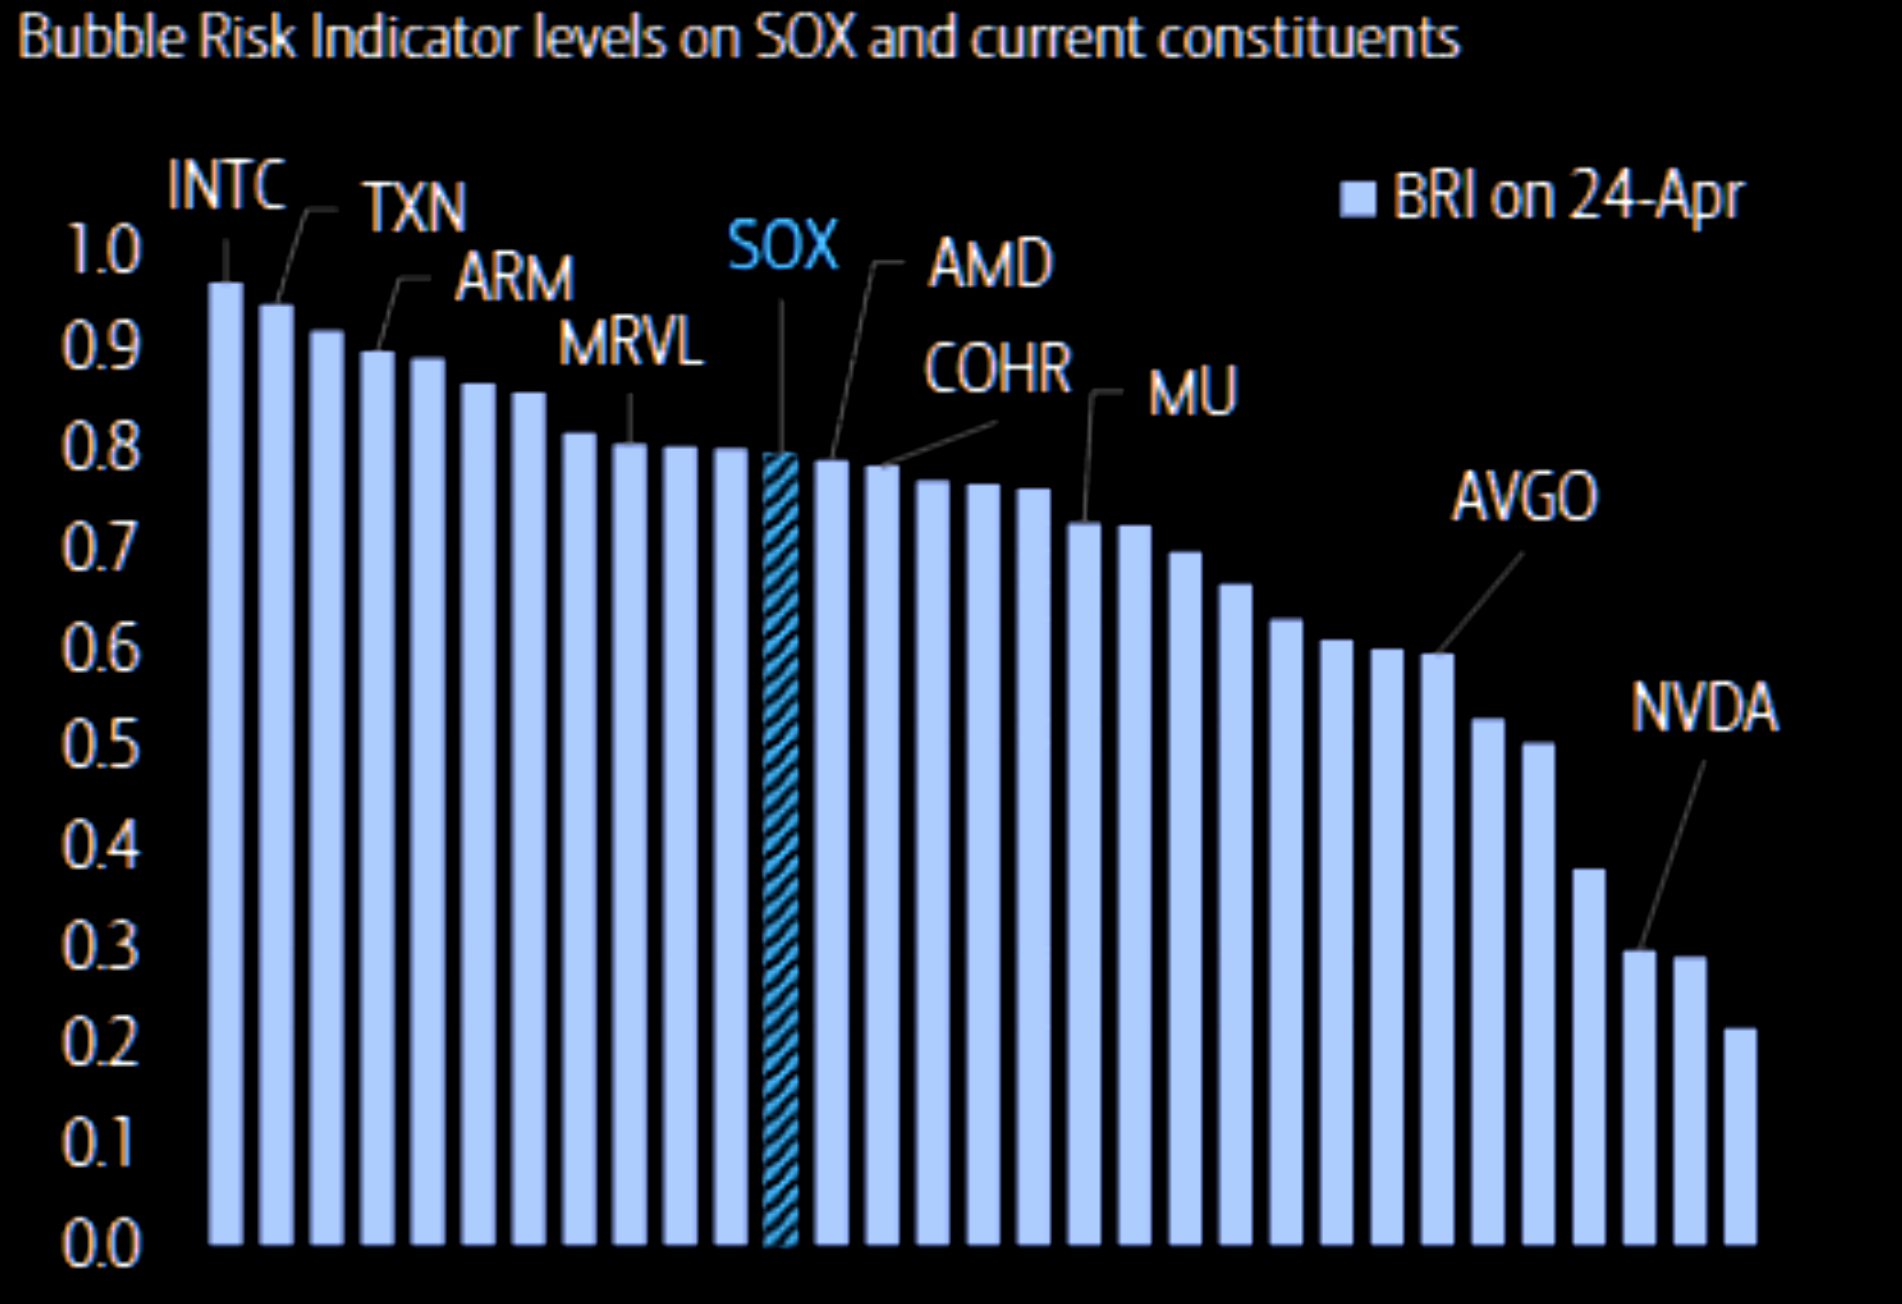 BofA BofA |
|
| This isn’t isolated… it’s broadening |
| Oil squeeze | | Oil bounced cleanly off the 50-day MA and continues to squeeze higher. Despite the move, RSI is still sitting at relatively modest levels. | 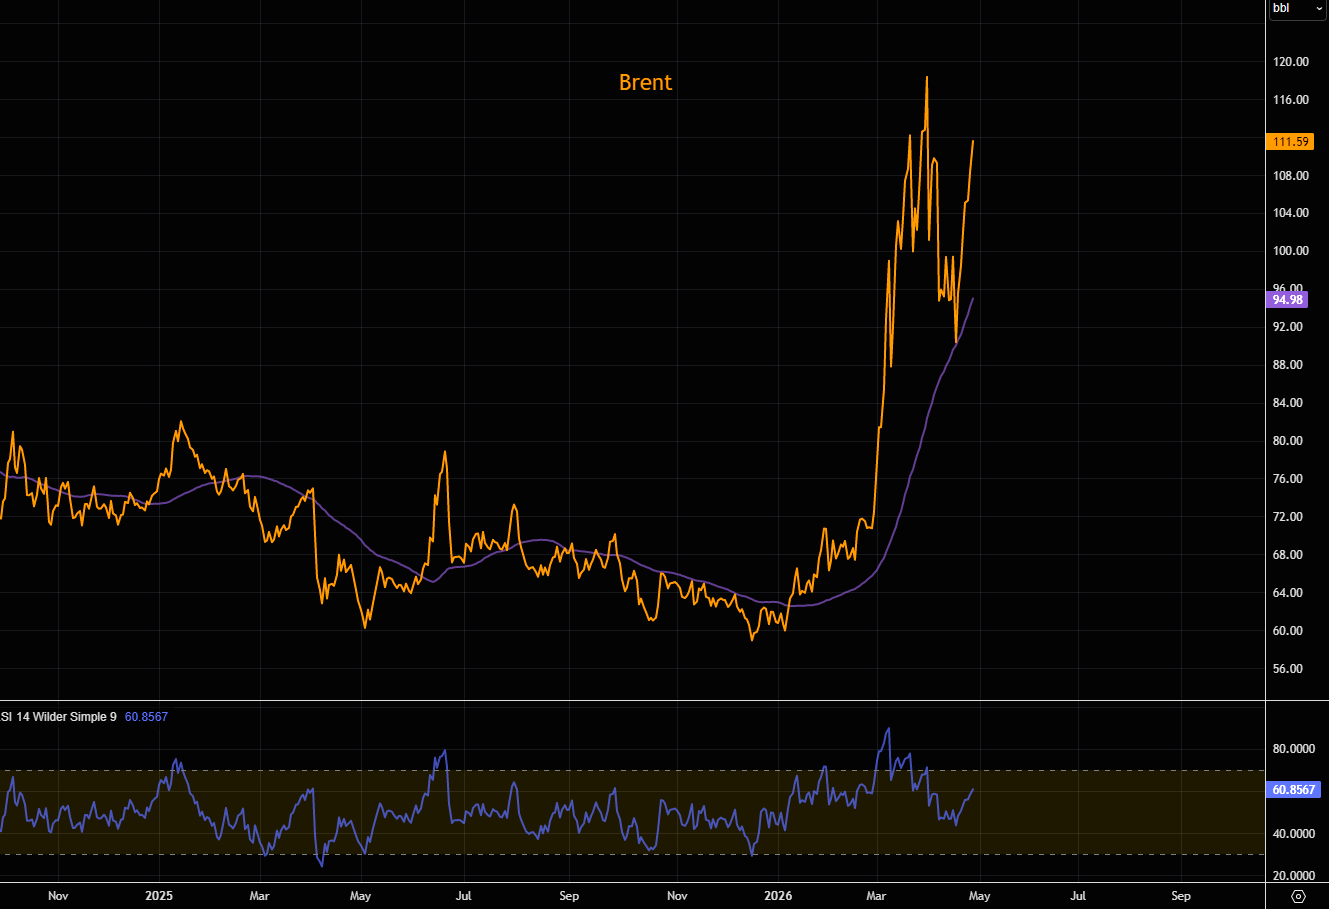 LSEG Workspace LSEG Workspace |
|
| Overshooting? | | $150 oil isn’t just a tail risk… it’s what the math points to if this drags on. Does this drag us back toward the big red line? | 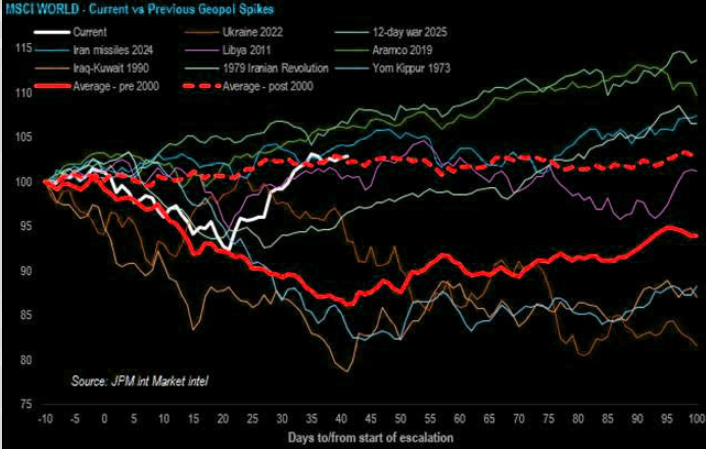 JPM JPM |
|
| Vol and tails | | Volatility is still mispricing tails on both sides. At the index level, dealers are roughly flat to short gamma and flip even shorter on the upside — GS estimates that ~+4% from Thursday’s close puts them around -$10bn SPX gamma. What’s unusual is that skew hasn’t flattened with the move, breaking the typical relationship. Sitting near highs, even small upside in spot could trigger outsized volatility moves. Bottom line: this setup favors owning calls over delta. | 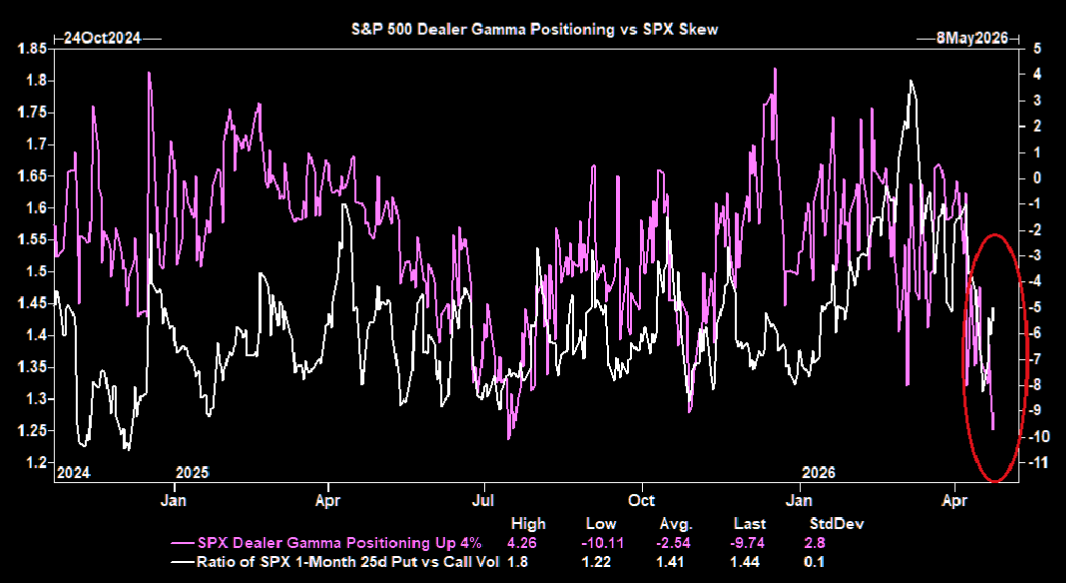 GS GS |
|
| Rates vol | | Despite the 10-year trading back at late-March levels, MOVE has collapsed and remains at relatively depressed levels. Is rates volatility pricing perfection? | 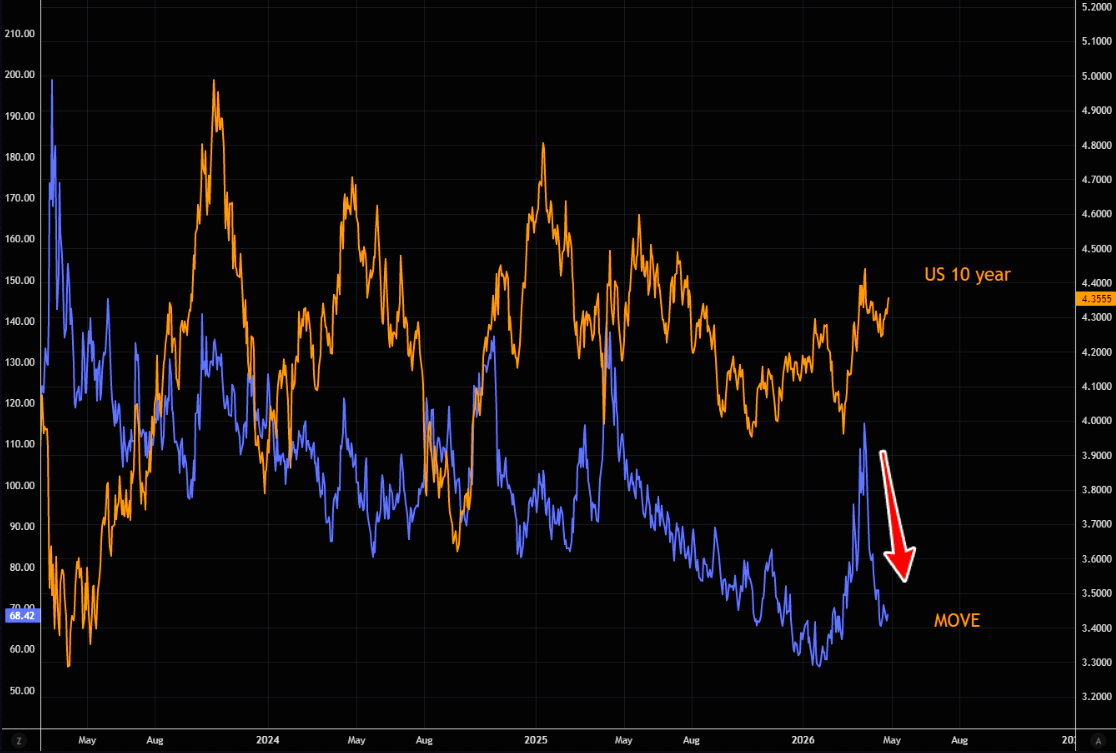 LSEG Workspace LSEG Workspace |
|
| A quarter of all power consumption | | Most industry experts believe that the current run rate of DC development is consistent with a 20-30% share of queries from Agentic AI in the US by 2030 and Europe by 2035. GS: “We estimate that a mere 10pp increase in Agentic AI adoption rates would boost European datacenter needs by +25% (by 2035E; see here). By then, DCs would account for c.25% of Europe’s power consumption, vs low single digit currently, in our upside case.” | 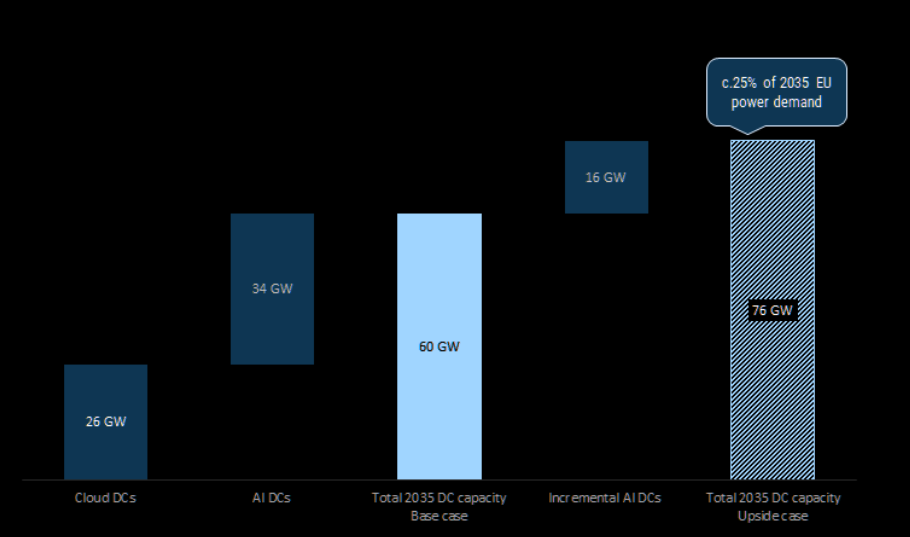 GIR GIR |
|
|