

Vestas skriver i Q1-regnskab:
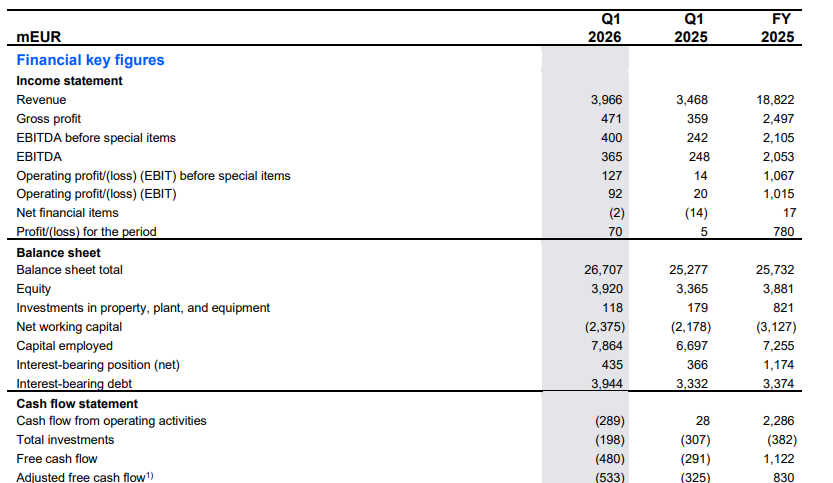
In the first quarter of 2026, Vestas generated revenue of EUR 3,966m – an increase of 14.4 percent compared to the year-earlier period. EBIT before special items amounted to EUR 127m, resulting in an EBIT margin before special items of 3.2 percent, compared to 0.4 percent in the first quarter of 2025.
Adjusted free cash flow amounted to EUR (533)m compared to EUR (325)m in the first quarter of 2025.
The quarterly intake of firm and unconditional wind turbine orders amounted to 4,504 MW, a 44 percent increase from first quarter 2025. The value of the wind turbine order backlog was EUR 36.3bn as at 31 March 2026.
In addition to the wind turbine order backlog, at the end of the quarter, Vestas had service agreements with expected contractual future revenue of EUR 39.8bn. Thus, the value of the combined backlog of wind turbine orders and service agreements stood at EUR 76.1bn – an increase of EUR 6.3bn compared to the year-earlier period.
In line with Vestas’ general capital structure strategy and with the purpose of adjusting Vestas’ capital structure and cover issues of shares under our long-term incentive programmes, the Board has decided to initiate a new share buy-back of EUR 100m.
The full-year guidance is maintained: Revenue is expected to range between EUR 20bn and 22bn, including Service revenue. Vestas expects to achieve an EBIT margin before special items for the Group of 6-8 percent, and total investments1) are expected to amount to approx. EUR 1.2bn in 2026.
ØU Kommentar: Vestas leverede en omsætning tre procent højere end analytikernes forventning. EBITDA-driftsresultat før særlige poster landende markant højere end forventet – på 400 mio. Euro – mod forventningen på 324 mio. Euro – Forvent markant fremgang i Vestas aktien i dag.
———————–
Q1 faktisk:
—————————
Consensus estimates as of 27 April 2026
| Financials (mEUR) | Average | High | Low | # est. | Average | High | Low | # est. | Average | High | Low | # est. | Average | High | Low | # est. | ||||
| Q1 2026 | Q1 2026 | Q1 2026 | Q1 2026 | 2026 | 2026 | 2026 | 2026 | 2027 | 2027 | 2027 | 2027 | 2028 | 2028 | 2028 | 2028 | |||||
| Total Revenue | 3,856 | 4,116 | 3,476 | 23 | 21,001 | 22,336 | 19,834 | 25 | 22,812 | 24,648 | 19,235 | 25 | 23,829 | 27,149 | 18,268 | 25 | ||||
| Revenue, Onshore (Power solutions) | 2,288 | 2,551 | 2,048 | 22 | 13,701 | 15,296 | 12,679 | 25 | 14,695 | 16,611 | 11,759 | 25 | 15,120 | 18,892 | 10,868 | 25 | ||||
| Revenue, Offshore (Power solutions) | 633 | 825 | 391 | 22 | 3,398 | 4,207 | 2,625 | 25 | 4,009 | 4,802 | 3,050 | 25 | 4,355 | 5,635 | 3,187 | 25 | ||||
| Revenue, Service | 928 | 1,012 | 882 | 22 | 3,902 | 4,470 | 3,720 | 25 | 4,108 | 4,567 | 3,784 | 25 | 4,354 | 4,885 | 3,928 | 25 | ||||
| Gross profit | 439 | 569 | 372 | 17 | 3,034 | 3,325 | 2,769 | 20 | 3,475 | 4,058 | 2,638 | 20 | 3,716 | 4,521 | 2,443 | 20 | ||||
| EBITDA before special items | 324 | 400 | 265 | 19 | 2,564 | 2,719 | 2,259 | 24 | 2,970 | 3,461 | 2,221 | 24 | 3,194 | 3,865 | 2,106 | 24 | ||||
| EBIT before special items | 71 | 160 | 9 | 23 | 1,474 | 1,594 | 1,143 | 25 | 1,874 | 2,184 | 1,062 | 25 | 2,080 | 2,488 | 949 | 25 | ||||
| EBIT, Power Solutions | 13 | 115 | (57) | 22 | 1,233 | 1,412 | 991 | 24 | 1,561 | 1,945 | 890 | 23 | 1,681 | 2,162 | 657 | 23 | ||||
| EBIT, Service | 154 | 167 | 145 | 22 | 644 | 685 | 547 | 24 | 730 | 880 | 568 | 23 | 819 | 968 | 687 | 23 | ||||
| Not allocated | (97) | (90) | (108) | 22 | (395) | (373) | (469) | 24 | (409) | (357) | (499) | 23 | (418) | (358) | (550) | 23 | ||||
| Special items | (1) | 8 | (15) | 21 | (1) | 8 | (25) | 21 | 0 | 0 | 0 | 21 | 0 | 0 | 0 | 21 | ||||
| EBIT after special items | 70 | 160 | 9 | 23 | 1,473 | 1,594 | 1,143 | 25 | 1,874 | 2,184 | 1,062 | 25 | 2,080 | 2,488 | 949 | 25 | ||||
| Income from JV and associates | 1 | 4 | (5) | 23 | 6 | 21 | (20) | 23 | 8 | 25 | (20) | 23 | 9 | 34 | (20) | 23 | ||||
| Net financials | (7) | 30 | (26) | 23 | (35) | 50 | (108) | 25 | (30) | 62 | (100) | 25 | (26) | 82 | (100) | 25 | ||||
| Profit before tax | 65 | 191 | (12) | 23 | 1,444 | 1,591 | 1,068 | 25 | 1,851 | 2,191 | 990 | 25 | 2,062 | 2,543 | 867 | 25 | ||||
| Income tax | (16) | 3 | (48) | 23 | (356) | (267) | (406) | 25 | (456) | (248) | (570) | 25 | (509) | (217) | (661) | 25 | ||||
| Net profit | 49 | 143 | (9) | 23 | 1,087 | 1,193 | 801 | 25 | 1,394 | 1,641 | 743 | 25 | 1,553 | 1,880 | 650 | 25 | ||||
| Free Cash Flow | 1,001 | 1,802 | 291 | 24 | 1,385 | 2,225 | (189) | 24 | 1,441 | 2,153 | (10) | 24 | ||||||||
| Dividend per share | 0.2 | 0.4 | 0.1 | 24 | 0.3 | 0.5 | 0.1 | 24 | 0.3 | 0.6 | 0.1 | 24 | ||||||||
| Adj. earnings per share | 1.1 | 1.2 | 0.8 | 25 | 1.4 | 1.7 | 0.7 | 25 | 1.6 | 2.0 | 0.7 | 25 | ||||||||
| Order intake (MW) | 4,771 | 5,014 | 4,178 | 20 | 18,128 | 21,190 | 15,700 | 22 | 19,171 | 22,937 | 15,816 | 20 | 19,712 | 23,223 | 15,639 | 20 | ||||
| Onshore order intake (MW) | 2,007 | 2,254 | 1,418 | 20 | 14,291 | 16,198 | 11,500 | 23 | 15,192 | 18,628 | 12,066 | 21 | 15,479 | 18,727 | 11,639 | 21 | ||||
| Offshore order intake (MW) | 2,764 | 2,800 | 2,760 | 20 | 3,824 | 5,310 | 2,897 | 22 | 3,934 | 5,000 | 2,541 | 20 | 4,188 | 5,600 | 3,200 | 20 | ||||
| Order intake (mEUR) | 5,456 | 5,766 | 4,734 | 17 | 19,277 | 23,099 | 16,907 | 19 | 20,021 | 23,887 | 15,450 | 19 | 20,437 | 24,478 | 14,340 | 19 | ||||
| Onshore order intake (mEUR) | 1,994 | 2,311 | 1,470 | 15 | 14,667 | 16,674 | 12,186 | 18 | 15,374 | 19,531 | 11,825 | 18 | 15,534 | 19,690 | 11,174 | 18 | ||||
| Offshore order intake (mEUR) | 3,440 | 3,920 | 3,036 | 15 | 4,694 | 6,425 | 3,339 | 17 | 4,870 | 6,750 | 2,870 | 17 | 5,194 | 7,560 | 3,840 | 17 | ||||
| Deliveries (MW) | 2,728 | 2,950 | 2,425 | 19 | 16,368 | 18,450 | 15,201 | 23 | 17,882 | 19,604 | 14,670 | 23 | 18,548 | 21,450 | 13,744 | 23 | ||||
| Onshore deliveries (MW) | 2,220 | 2,400 | 1,989 | 19 | 13,635 | 15,678 | 12,431 | 23 | 14,666 | 16,389 | 11,644 | 23 | 15,114 | 18,330 | 10,870 | 23 | ||||
| Offshore deliveries (MW) | 508 | 684 | 287 | 19 | 2,733 | 3,262 | 2,100 | 23 | 3,216 | 3,914 | 2,254 | 23 | 3,434 | 4,306 | 2,428 | 23 |
Analyst consensus collected with cut-off date 27 April 2026, pre disclosure of the Q1 2026 report