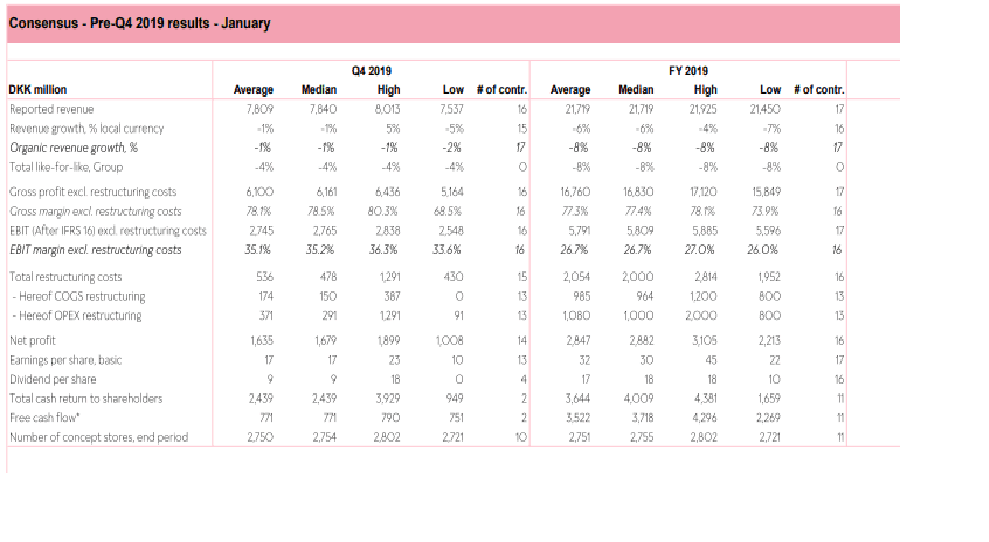
Kommentar: Pandora kom i Q4 ud med et bedre salg end forventet af analytikerne: Det endte på 7956 mio. kr. mod forventet 7809 mio. kr. Altså kna to procent bedre. Driftsoverskud (EBIT) før restruktureeingsomkostninger endte på 2806 mio. kr.mod forventet 2745 mio. kr. Driftsoverskud efter restruturering blev mod forventet 2302 mio. kr. Bundlinjen blev et overskud på 1741 mio. kr. mod forventet 1635 mio. kr.
Fra Pandora Q4
EXECUTIVE SUMMARY
Like-for-like improves following brand relaunch- Turnaround initiatives continue
Q4 2019 Highlights
• Programme NOW delivers solid results – total like-for-like improved in Q4
• Three of the seven largest markets delivered positive like-for-like in Q4 – an important step forward
• The Q4 performance confirms that Programme NOW has positive impact on the underlying business – the turnaround continues in 2020
In Q4 2019, Programme NOW showed solid results as the growth momentum improved materially. Italy, France and Germany delivered positive like-for-like, and growth momentum in the US and the UK also improved. The momentum change substantiates the Programme NOW diagnosis and turnaround plan and demonstrates that Pandora is on the
right path to return to sustainable growth.
Pandora has reviewed the network strategy and essentially confirms the direction previously communicated. Pandora will continue to open stores in white-space areas while adopting a more rigorous and systematic approach to the store network. Additionally, Pandora will step-change investments in the online channel while opportunistically considering use of additional online market-places.
In 2020, the turnaround initiatives will continue to create a much healthier foundation for long-term sustainable performance. Pandora expects the growth performance to improve from -8% like-for-like in 2019 to negative mid single-digit like-for-like in 2020. The like-for-like development in 2020 is a result of further reduction of promotional discounting activity, expected weak underlying performance in China and an underlying performance improvement in the majority of the other markets.
Net store openings/closings and inventory changes are expected to have negligible impact on revenue. The organic growth is expected to be -3 to -6%. The EBIT margin excluding restructuring costs is expected to be above 23%. The financial guidance does not include any impact from the coronavirus.
Alexander Lacik, President and CEO of Pandora, says:
“With 2019 behind us, we have completed the first year of our 2-year turnaround. We have made significant changes in a very short time, and the results in Q4 give us confidence. Consumers are responding positively to our commercial initiatives. Like-for-like is improving, and we have built a healthier foundation for the business. In 2020, we will continue to invest significantly to drive the topline, strengthen our organisational capabilities and pursue further cost reductions to fund our growth initiatives. Our priority remains to do what is right for the company in the long-term.”
—————————–
| REVENUE AND LIKE-FOR-LIKE | |||||||||||||
| REVENUE PER CHANNELS | |||||||||||||
| DKK million | Q1 2017 | Q2 2017 | Q3 2017 | Q4 2017 | Q1 2018 | Q2 2018 | Q3 2018 | Q4 2018 | Q1 2019 | Q2 2019 | Q3 2019 | Q4 2019 | |
| PANDORA owned retail | 1.965 | 2.002 | 1.970 | 3.845 | 2.592 | 2.765 | 2.608 | 4.930 | 3.061 | 3.121 | 2.783 | 5.216 | |
| – of which concept stores | 1.539 | 1.584 | 1.601 | 2.812 | 2.007 | 2.167 | 2.083 | 3.708 | 2.404 | 2.403 | 2.168 | 3.644 | |
| – of which online stores | 304 | 298 | 264 | 812 | 438 | 447 | 400 | 1.019 | 477 | 543 | 455 | 1.307 | |
| – of which other points of sale | 122 | 120 | 105 | 221 | 147 | 151 | 125 | 203 | 181 | 175 | 160 | 264 | |
| Wholesale | 2.723 | 2.489 | 2.820 | 3.438 | 2.178 | 1.733 | 2.053 | 2.669 | 1.503 | 1.359 | 1.383 | 2.480 | |
| – of which concept stores | 1.492 | 1.478 | 1.589 | 2.119 | 1.226 | 984 | 1.186 | 1.614 | 854 | 797 | 758 | 1.434 | |
| – of which other points of sale | 1.231 | 1.011 | 1.231 | 1.319 | 952 | 749 | 867 | 1.055 | 649 | 562 | 625 | 1.046 | |
| Third-party distribution | 471 | 334 | 404 | 320 | 345 | 321 | 321 | 291 | 239 | 214 | 249 | 261 | |
| Total revenue | 5.159 | 4.825 | 5.194 | 7.603 | 5.115 | 4.819 | 4.982 | 7.890 | 4.804 | 4.693 | 4.415 | 7.956 | |
| LIKE-FOR-LIKE | |||||||||||||
| DKK million | Q1 2017 | Q2 2017 | Q3 2017 | Q4 2017 | Q1 2018 | Q2 2018 | Q3 2018 | Q4 2018 | Q1 2019 | Q2 2019 | Q3 2019 | Q4 2019 | |
| PANDORA owned retail | -10% | -7% | -8% | 0% | |||||||||
| Wholesale1 | -11% | -14% | -14% | -10% | |||||||||
| Third-party distribution1 | -11% | -14% | -14% | -10% | |||||||||
| Total like-for-like | -2% | 1% | -2% | 2% | -5% | -1% | -3% | -7% | -10% | -10% | -10%2 | -4%2 | |
| 1Like-for-like for wholesale and third-party distribution is based on consolidated estimation | |||||||||||||
| 2Excluding Hong Kong SAR | |||||||||||||
| ORGANIC GROWTH | |||||||||||||
| DKK million | Q1 2017 | Q2 2017 | Q3 2017 | Q4 2017 | Q1 2018 | Q2 2018 | Q3 2018 | Q4 2018 | Q1 2019 | Q2 2019 | Q3 2019 | Q4 2019 | |
| PANDORA owned retail | 10% | 3% | 2% | 1% | 2% | ||||||||
| – of which concept stores | 7% | 2% | -1% | -2% | -4% | ||||||||
| – of which online stores | 25% | 6% | 20% | 12% | 25% | ||||||||
| – of which other points of sale | -9% | 1% | -4% | 9% | 4% | ||||||||
| Wholesale | -13% | -27% | -17% | -31% | -7% | ||||||||
| – of which concept stores | -8% | -21% | -10% | -33% | -11% | ||||||||
| – of which other points of sale | -21% | -34% | -26% | -30% | -2% | ||||||||
| Third-party distribution | 1% | -23% | -27% | -21% | -7% | ||||||||
| Total revenue | 7% | 10% | 14% | 12% | 0% | -2% | -7% | -1% | -12% | -7% | -14% | -1% | |