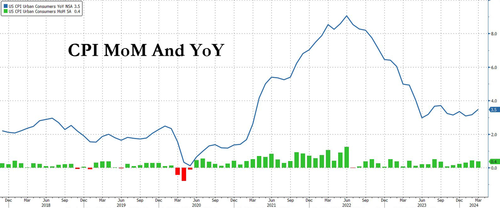
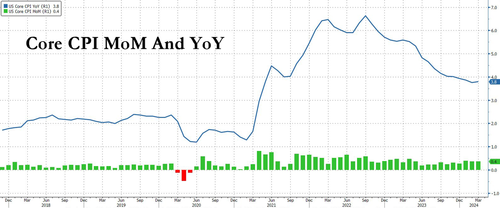
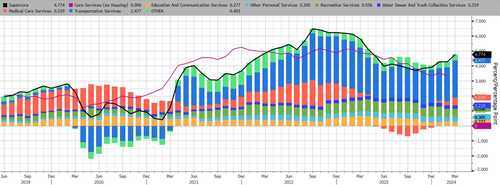
Uddrag fra Zerohedge og finanshuse
While the April payrolls number – weaker than the lowest estimate – came and went, and accelerated the market’s upward ascent without a glitch (now that bad news is good news again, unlike a month ago when the blow out jobs number pushed stocks higher and when good news was good news), all eyes now turn to tomorrow’s CPI number, where as Goldman trader Ben Snider writes, “though GS forecast of ~0.3% is in line with consensus, there should still be market upside if the print comes in at 0.3%… This is because it would support the GS baseline outlook for a cut in July, where the market is only pricing a ~1/4 probability of a cut.”
That’s really the TL/DR of what to expect from the market tomorrow… with one major provision: a red-hot CPI print and the Fed will likely be unable to twist narrative expectations for a July – or even September – rate cut in time absent something big breaking (as most talking Fed heads Powell included, recently asked why would the “data dependent Fed” be cutting if inflation is again ascendant), which in turn means that the Fed would unlikely cut in 2024 as any rate cut during the July 31 meeting (really August) would be seen as too close to the November elections and would prompt howls of outrage from Trump, republicans and a majority of the population. Furthermore, should rate cuts be taken off the table, expect a collapse in risk assets, as the market realizes that unless it itself crashes, the Fed will not move.
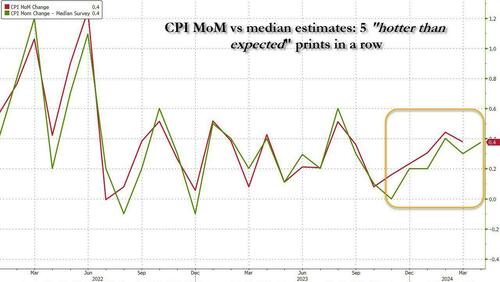
Which is why we are rather confident that after five consecutive months of CPI printing hotter than expectations…
… tomorrow’s number will “miss”, printing at, or cooler than, the 3.6% YoY core CPI estimate (discussed in greater detail in this article). Not because inflation is actually easing, not by a long shot as anyone who shops for, well, anything can tell you, but rather because the manipulative (and criminally leaking) Biden BLS has its marching orders as per the logic laid out above, and to avoid a market bloodbath in the months ahead of the election, now is when the BLS creative fiction team needs to start, well, coming up with creative fiction.
There are two other reasons why we expect inflation to slow down.
- The first has to do with a reversal of the “January spike“: recall that a big part of the data leak scandal currently rocking the Biden BLS had to do with the “explanation” (and justification) for the red-hot January inflation number. Long story, short, the BLS made it so that home inflation was front-loaded in 2024 (in this particular case, the weights for single-family detached homes was raised well above expectations) and with every passing month they will adjust the glideslope of shelter inflation to come in below estimates, thereby allowing the overall number to also come in more dovish than expected.
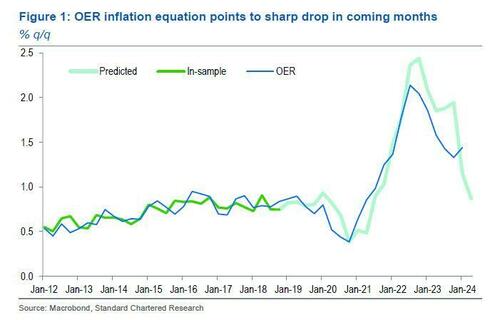
- The second reason for a reversal in the hot inflation prints also has to do with housing, and specifically the catch down of Owner-Equivalent Rent to where actual rents can currently be found. This, as we discussed last week, is the place where the BLS by far has the most freedom to fudge the numbers since OER rents are lagging actual market rents anywhere between 12 and 18 months. As such, the Biden statisticians can come up with any number they want and still seem credible (ignoring the fact that by the time the Fed actually does start cutting rates, actual rents will once again be rising even faster, but we’ll cross that bridge when we come to it).
Putting it all together, we believe that when thinking of tomorrow’s headline and core CPI prints, one should ignore all logic and reasoning, all recent observations of rising commodity prices, and merely think like a Democrat apparatchik who has gotten the “tap on the shoulder” with instructions how to make Biden as good as possible.
With that in mind, here is what the market expects tomorrow:
- Headline CPI is expected to rise again in March, up 0.4% MoM flat vs the 0.4% increase in March (which as a reminder came in hotter than expected), while core CPI is seen rising 0.3% M/M, easing off the unexpectedly hot 0.4% March increase.
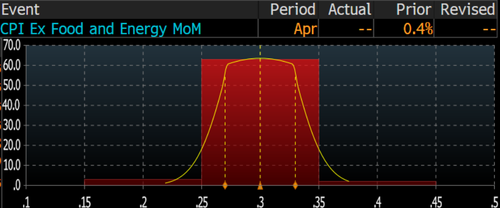
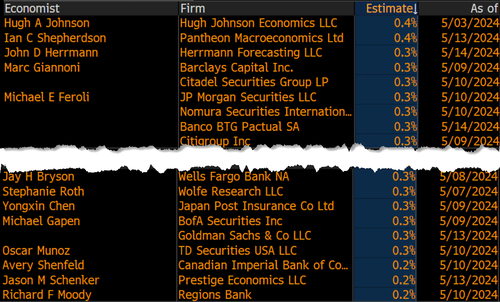
- It’s worth noting that there is an almost unimodal distribution for tomorrow’s core CPI with virtually every single bank expecting a 0.3% print (63 out of 68) with just a handful of economists slotting a 0.4% and a 0.2% forecast (see below). Needless to say, a 0.2% core CPI print and we are off to the races and probably a July rate cut.
- These monthly increases should translate into a 3.4% increase in headline CPI – down from 3.5% in March and above the recent low of 3.0% hit last June
- Core CPI is expected to dip from 3.8% to 3.6%, which would make it the lowest since April 2021. Of course, in January we were also supposed to see a 3.7% print and instead we got 3.9%, but that frontloading of “bad data” ahead of the election, is precisely why we expect a miss this time around.
- While in late 2023 the prevailing conventional wisdom was that Inflation was approaching the Fed’s 2% target far sooner than economists had expected – and in fact, in November, the Fed’s preferred inflation measure, the core PCE, slipped below the 2% target, sliding to 1.9% on a six-month annualized basis due to continued weakness in goods prices offset by services – it has since stalled notably proving once again that the “last mile” in the inflation fight, that from 3% to 2% will prove far more challenging than many had recently expected; in fact it’s why we are dead certain the Fed will – sooner or later – raise its inflation target to 3%. That said, the January spike in Supercore inflation which led some to wonder if the current cycle of easing inflation is over and a new cycle of rising prices has started, was only reinforced by the steep rise in March Supercore print.
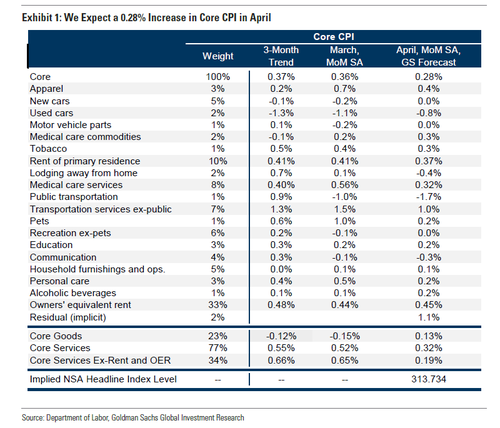
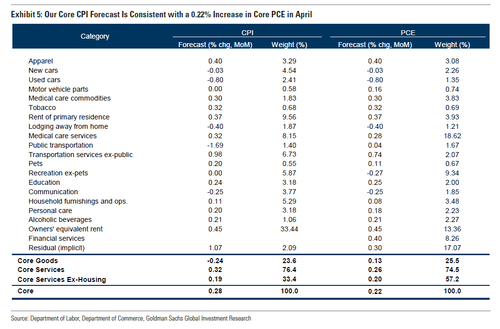
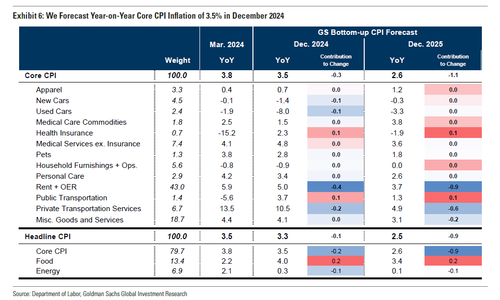
Turning to the specifics of the report, in its CPI preview note (available to pro subscribers in the usual place) Goldman’s economists are – like us – “skewed dovish”, and expect a 0.28% increase in April core CPI (vs. 0.3% consensus), corresponding to a year-over-year rate of 3.61% (vs. 3.6% consensus). The bank’s forecast is consistent with a 0.19% increase in CPI core services excluding rent and owners’ equivalent rent…
… and is consistent with a 0.22% increase in core PCE in April.
Goldman highlights three key component-level trends for the March report, all of which corroborate a weaker than expected print:
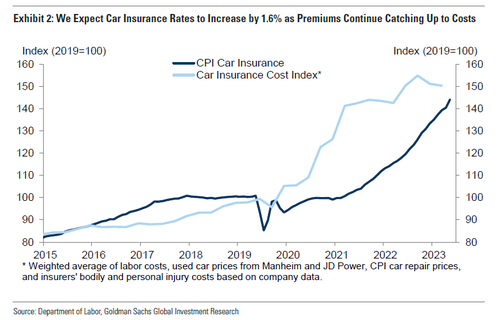
- Car insurance. The bank expects car insurance rates to increase 1.6% this month as premiums continue to catch up to costs. Higher car prices, repair costs, and medical and litigation costs have all put pressure on insurance companies to raise prices, but premiums have been passed onto consumers with a long lag in part because insurers have to negotiate price increases with state regulators. Looking ahead, Goldman expects the sequential pace of price increases to gradually slow to around 0.5% by the end of the year as prices catch up to costs, which would lower the contribution of car insurance to year-over-year core CPI inflation from 0.8pp to 0.5pp by December. Car insurance has a much smaller weight and is measured using different source data in the PCE index, so it won’t have meaningful effects on PCE inflation.
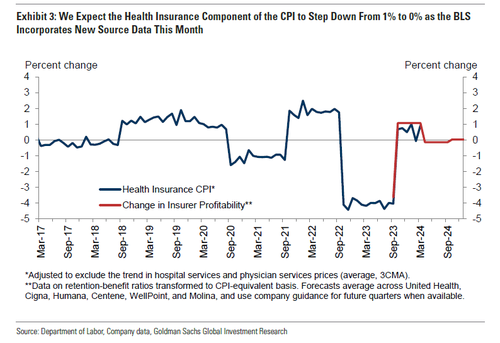
- Health insurance. Next, Goldman expects the sequential pace of the CPI’s health insurance component to slow from +1% to 0% month-over-month as the BLS incorporates new source data based on insurers’ profitability this month. As with car insurance, health insurance is measured using different source data in the PCE index, so do not expect this update to affect PCE inflation.
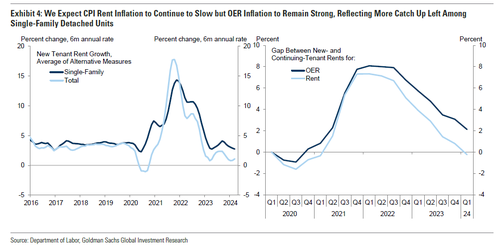
- Shelter. Goldman expects rent inflation to slow to 0.37% as the gap between rents for new and continuing leases continues to close but for OER inflation to remain strong at 0.45%, reflecting stronger new-tenant rent growth and a larger gap between new- and existing-tenant rents among single-family detached units, which receive a much larger weight in OER. Going forward, somewhat stronger rent growth for single-family homes will likely lead OER to continue to outpace rent in the CPI, Goldman warns and adds that overall shelter inflation will be running at a monthly pace of around 0.34% by December 2024 (reflecting a 0.26% pace for rent and a 0.37% pace for OER), implying a year-over-year rate of 4.9%.
- Elsewhere in the report, Goldman expects a 2.5% pullback in airfares, reflecting lower jet fuel prices and declining prices. The bank also expects a 0.25% decline in communication prices now that the post-holiday price normalization has run its course and consistent with consumer electronics price data from Adobe. Finally, the bank assumes a 2bp boost to core CPI from this year’s tax preparation price hikes. So even pay taxes is now inflationary.
Going forward, the bank expects monthly core CPI inflation to remain in the 0.25-0.30% range for the next few months before slowing to around 0.2% by end-2024. The bank sees further disinflation in the pipeline in 2024 from rebalancing in the auto, housing rental, and labor markets, though we expect offsets from catch-up inflation in healthcare and car insurance and from single-family rent growth continuing to outpace multifamily rent growth. Goldman forecasts year-over-year core CPI inflation of 3.5% and core PCE inflation of 2.7% in December 2024.
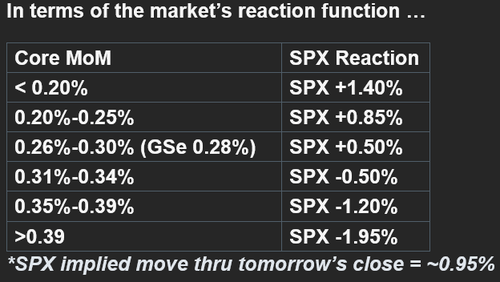
In terms of the market’s reaction function, Goldman trader Lee Coppersmith is out with a note (also available to pro subs) in which he makes the following market reaction prediction:
The straddle-implied move for tomorrow is 0.95%, down modestly from last month’s expectation of a 0.98% move and notably higher from the January’s 0.70% move on CPI day; this is also the highest since November, but generally on the low side over the past two years.
A quick look at JPMorgan finds the largest US bank also in line with Street estimates: the bank’s chief economist Michael Feroli sees headline MoM CPI printing +0.4%, in line with the Street, and sees Core MoM print +0.33%, also in line the Street’s +0.3% estimate. Similarly, on a YoY basis, Feroli sees headline inflation of 3.4% (vs. 3.5% in previous print) and he sees core inflation of 3.7% (vs. 3.8% in the previous print).
JPM’s market intel desk is likewise ready with its own analysis (link here for pro subs), and also looks at core CPI as the key variable:
- Above 0.4%. The first tail-risk scenario that would likely show smaller than expected disinflation in shelter prices and perhaps a reversal of the drags created by vehicle prices and public transportation price. Look for a sell-off across all risk assets and investors may find sanctuary in commodity plays with Defensives outperforming on the move lower. Probability 10%; SPX loses 1.75% – 2.50%,
- Between 0.35% – 0.40%. This scenario could be achieved from using the JPM forecast with slightly hotter than expected Core Goods. Given the Prices Paid components from ISM, we could see that filter into this CPI print. ISM-Mfg Prices Paid printed 60.9 vs. 55.4 survey; 55.8 prior. ISM-Srvcs Prices Paid printed 59.2 vs. 55.0 survey; 53.4 prior. Given market pricing and Powell’s comments, this outcome maybe looked through over the course of several days, but I think we still see stocks fall as bond yields move higher, reducing the probability of 2024 rate cuts. That said, the market is pricing in a disinflationary pathway for 24H2, perhaps as it expected 2023’s shelter disinflation finally hitting official prints. Ultimately, this scenario does not alter the investment hypothesis but may create a temporary soft patch that could be very short-term depending on the outcome of AI-related catalysts this week pand next. Probability 30%, SPX loses 0.5% – 1.25%.
- Between 0.30% – 0.35%. This is where both JPM and the Street forecasts lie (0.33% and 0.30%). OER and Rent inflation remain elevated and thus it will be difficult to see a material softening in inflation, both headline and core, until we witness stronger disinflation. To state the obvious, the closer the print is to the lower bound the stronger the positive reaction especially if we see a sub-0.30% print that rounds up to 0.3%. If the yield curve bull steepens in the response look for Cyclicals/Value to outperform Growth. Probability 40%SPX, outcomes range from a 50bps loss to a 1% gain.
- Between 0.25% – 0.30%. The first potential positive tail-risk, most likely achieved via a decline in shelter inflation. This positive tail could trigger a material rotation within Equities and could look very similar to Nov/Dec 2023, which was an ‘Everything Rally’ with SMid-caps outperforming. One potential risk is a short squeeze that causes some de-risking as shorts are closed and longs reduced. Probability 10%, SPX adds 1% – 1.5%.
- Between 0.20% – 0.25%. In order to see this, or the next tail outcome, we would need to see core goods decline alongside softer shelter inflation. Given the China PPI print, a decline in core goods feels more likely but would still not be enough to witness this scenario. Expect a strong decline in bond yields as the bond market puts a July cut back on the table. Equities and Credit would benefit as the Goldilocks returns. Probability 7.5%; SPX adds 1.5% – 2%.
- Below 0.20%. The last tail-risk scenario, we could even see June rate cut bets return as Immaculate Disinflation returns, a quarter lagged. Thinking about this through the “it’s too good to be true” lens, I do wonder if some investors would thus assume the 24Q1 GDP miss has morphed into a stronger economic growth slowdown and that this inflation miss is the proverbial canary in the coal mine. If yes, then any gains would give way to a choppier market as we await the next batch of growth data. Rates cuts due to “curing” inflation will look different than those accompanying an economy whose growth is compromised. Probability 2.5%; SPX adds 2% – 2.5%.
Focusing some more on how the market may interpret the numbers, here are three observations from Goldman traders
Ben Snider (US Portfolio Strategist)
Though GS forecast of ~0.3% is in line with consensus, there should still be market upside if the print comes in at 0.3%, conditional on the composition and the PPI data. This is because it would support the GS baseline outlook for a cut in July, where the market is only pricing a ~1/4 probability of a cut. The downside risk on a hot print is greater than the upside risk on a cool print because markets are already pricing a 1.5-2 cuts this year, 3 next year, and a strong growth outlook. Even with friendly inflation data it would be hard for the pricing of cuts to increase dramatically without a downside surprise to the growth outlook, which would not be ideal for equities… On recent CPI surprises SPX has moved by slightly less than 1%, with ‘lower quality’ equities like RTY, non-profitable tech (GSXUNPTC), and most shorted stocks (GSCBMSAL) moving by more. That is true both because of fundamental sensitivities to rates and because of positioning. Record gross leverage suggests there is still plenty of potential energy in investor positioning for a squeeze higher in those pockets of the market. The GS forecast for 0.3% would therefore point to owning upside in these ‘lower quality’ stocks. However, in recent prints these equity slices have had larger betas on market downside moves than on upside moves, so investors might instead consider owning levered expressions of ‘higher quality’ equities. After CPI, investor focus should turn back to the most important driver of stocks, which is growth. Recent economic data have disappointed, which has added to market optimism about the path of Fed policy. But stocks still appear to be pricing a very strong growth outlook. If CPI surprises to the upside, markets will have to re-evaluate the path of FCI and its impact on the US economy. If CPI is soft, that will support the FCI and growth outlook, but put additional weight on indicators like Retail Sales and Claims to reaffirm that the backdrop remains healthy.
Dom Wilson (Senior Markets Advisor)
It feels like the market has been a bit frozen waiting for this number. With the rallies in bonds and equities that we’ve seen, the asymmetry here is less clear than it was. A number like ours (0.28 on core) is probably a very modest relief. And given how much fear there’s been into the number, you could get some relief just being through it. If you get something better than our number, we’re likely to make fresh highs in stocks. But there’s real risk from an upside inflation surprise, particularly with the market relaxing a bit, and a high print would challenge the Fed’s narrative further. I think the retail number, which is released at the same time, is also important. We have had a run of softer data lately and US surprises have turned firmly negative. Our forecast is for a meaningful downside surprise as March retail strength is paid back. If that’s right, it could feed the view that growth is slowing. That could reinforce any bond upside from a friendlier CPI and, although it’s not as attractive as a week or two ago, the downside tail in bond yields still looks interesting. Equities should probably still welcome yield relief more than fear growth downside for now, at least at the index level, but a hot inflation/weak retail combo could open up the downside. The good news is that implied vol has come back down again – not all the way to the q1 lows, but enough that options look underpriced for event risk again. So I think short dated put protection against a long position or looking at call spreads to add some delta are sensible strategies again.
Joe Clyne (US Index Vol Trading)
The major story entering the CPI print in the equity derivatives space has been the dramatic compression of implied vol in all tenors pre-election. We are seeing 4-month 25 delta puts in SPX trade on the lowest vol handle since 2017 as vols have compressed and term structure has flattened. The vol compression speaks to how saturated the street is with both gamma and (in our opinion) vega as well around local levels. Realized vol has begun to compress over the course of the last week as liquidity has improved and the market has rallied back into the heart of dealer long strike positioning. The straddle for CPI itself in SPX is going out around 1%, but we like fading the vol crush more than we like playing the short-dated gamma tenors. Even as realized has compressed, it does not seem to justify the size of the vol crush, as realized has remained well over the levels that pushed vol this low in 2017. We net like owning options, and think implieds are low enough to own them outright. Gamma in RUT screens as more expensive in the wake of the GME/meme stock moves, so we would keep the bulk of our positioning in SPX/NDX to avoid taking a view on how long the meme stock narrative will drive public markets.
Lou Miller (Macro Thematic Structuring)
Over the last year, Hedge Fund VIPs vs Most short (GSPRHVMS) has been the most reactive on the day of both soft and hot headline prints. Following soft prints, the pair has underperformed as low quality assets rally on dovish outlook. This dynamic could exacerbate the latest short squeeze, which has been driven by resurgence of retail and drove one of the biggest 2d moves we’ve seen in this pair. The concern around crowding we flagged last week seems to be warranted and we continue to favor limited loss implementations to hedge these risks. On the long side, our Barra Beta pair (GSP1BETA) has historically been a winner on soft prints as the market re-assesses rate cut timeline… On inline prints, the HF pair has been resilient as the market moves back towards status quo. On hot prints, we’ve consistently seen a flight to quality and outperformance of HF VIPs vs Most Short. This is also exemplified by our high growth high margin (GSPUHGHM Index) and high beta momentum pairs (GSPRHIMO Index).
We conclude with the view from JPM’s market intel team, which is generally in line with the above opinions from Goldman’s trading desk:
Tactically bullish. The fundamental view of (i) at/above trend GDP plus (ii) positive earnings growth and (iii) a paused Fed still equates to a bull market. A hotter print this week is, to a certain extent, expected by inflation markets. Those markets are pricing in a 24H2 similar to 23H2, reflecting shelter disinflation and perhaps seasonal impacts. Any outcome where the Core MoM declines sequentially will likely be eventually read as a positive by the market. Further, Powell’s comments seem to express a preference to cut rates with the bar to hike potentially out of reach in 2024. If we have passed the YTD peak in bond yields, then it is tough to conceive a scenario where stocks experience a technical correction (>10%) even if positioning gets stretched.


