Uddrag fra Deutsche Bank/ Zerohedge:
Everyone knows that monetary policy acts with a lag, but the $64 trillion question – and in the case of global capital markets, literally – is how big said lag is at a time when central banks have engaged in one of the most aggressive hiking cycles in history to stem the runaway inflation spawned by the Helicopter Money unleashed during the covid shock, and not just by the Fed, which in 2022 saw the most rate hikes in a calendar year in history…
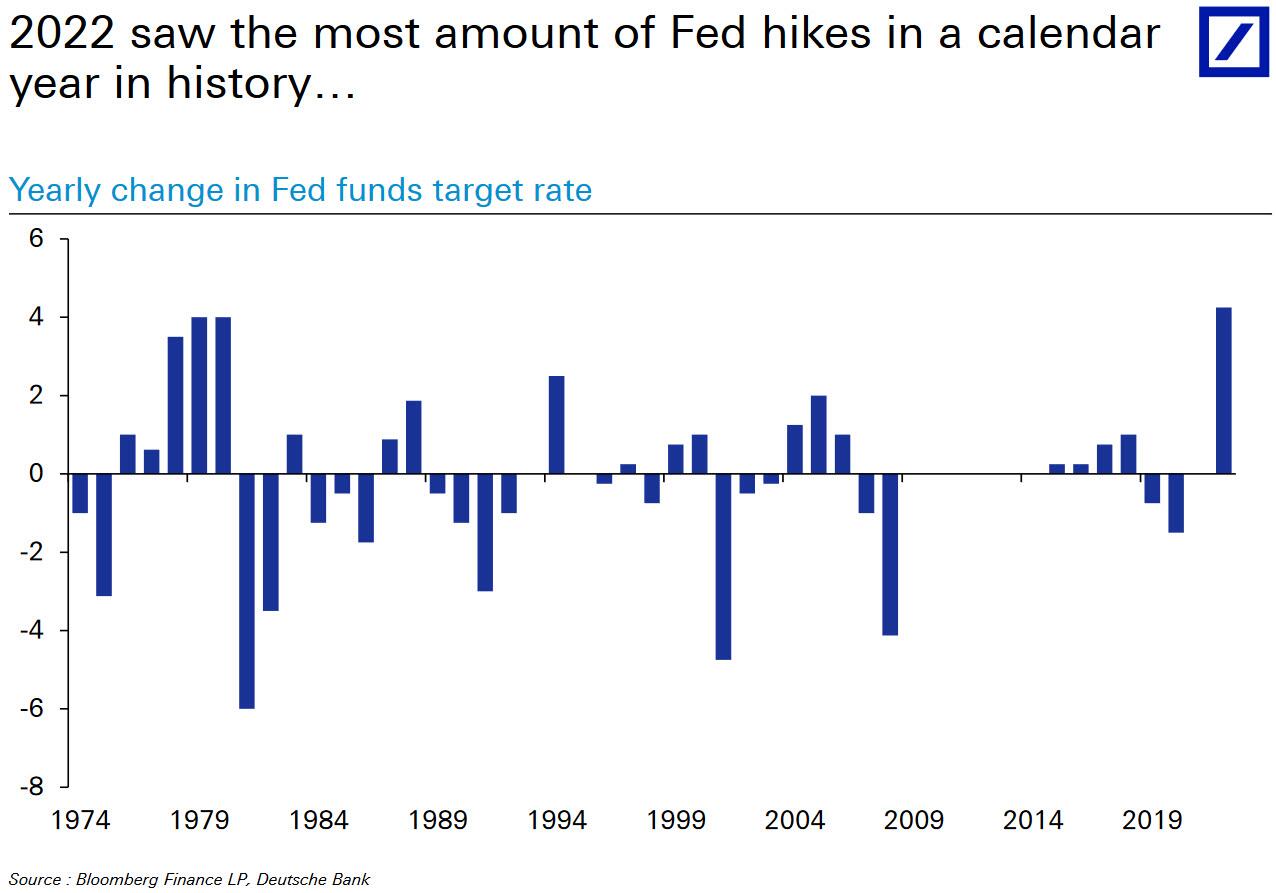
… but by all developed central banks.
Why this obsession with the lag? Because, as DB’s head of thematic research (and in house credit guru not to mention aspiring piano player) Jim Reid writes in a recent note, “Most (but not all) big hiking cycles bring recessions with a lag”…
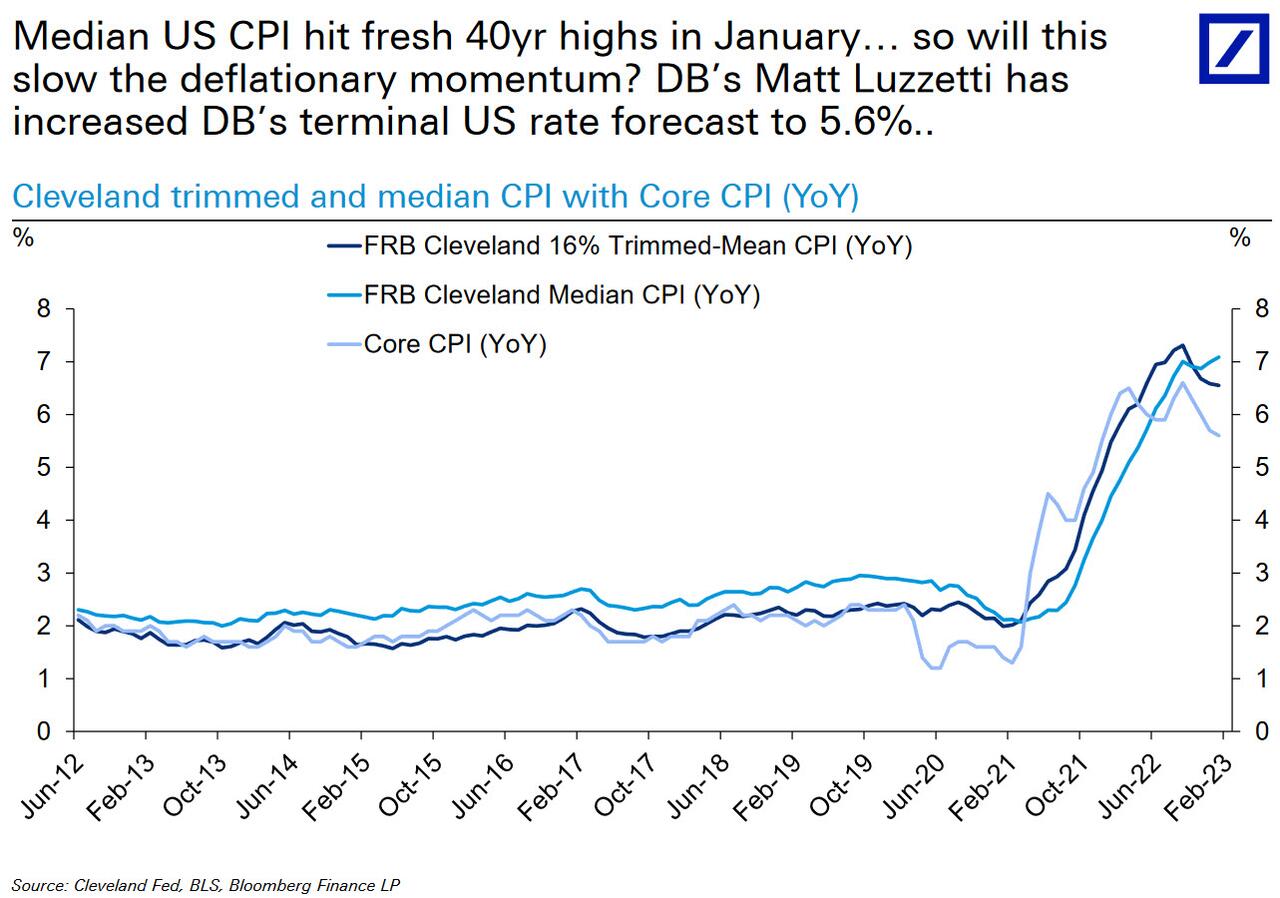
… and the ones that do “tend to be when the Fed is furthest away from its dual mandate and that invert the curve.” In case it’s unclear, both apply to this cycle, but certainly inflation is the outlier with prices still rising at a 6%+ annual clip.
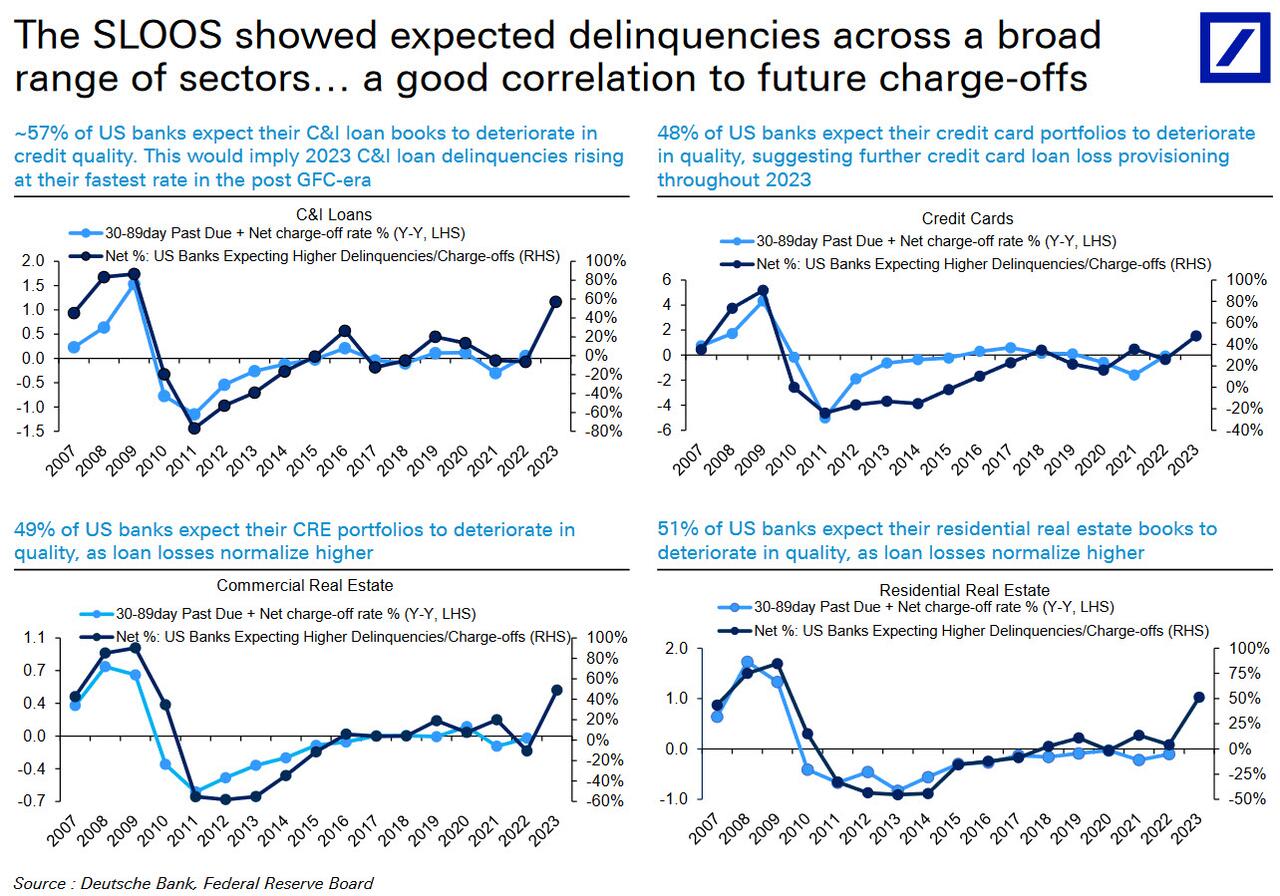
So with that in mind, let’s take a look at some of the key “lag” indicators, starting with the US Senior Loan Officers Survey (SLOOS), which as we noted recently has painted a “dire picture” for the economy as “Loan Standards Are Approaching Record Tightness As Loan Demand Plummets“, and which leads GDP by two quarters…
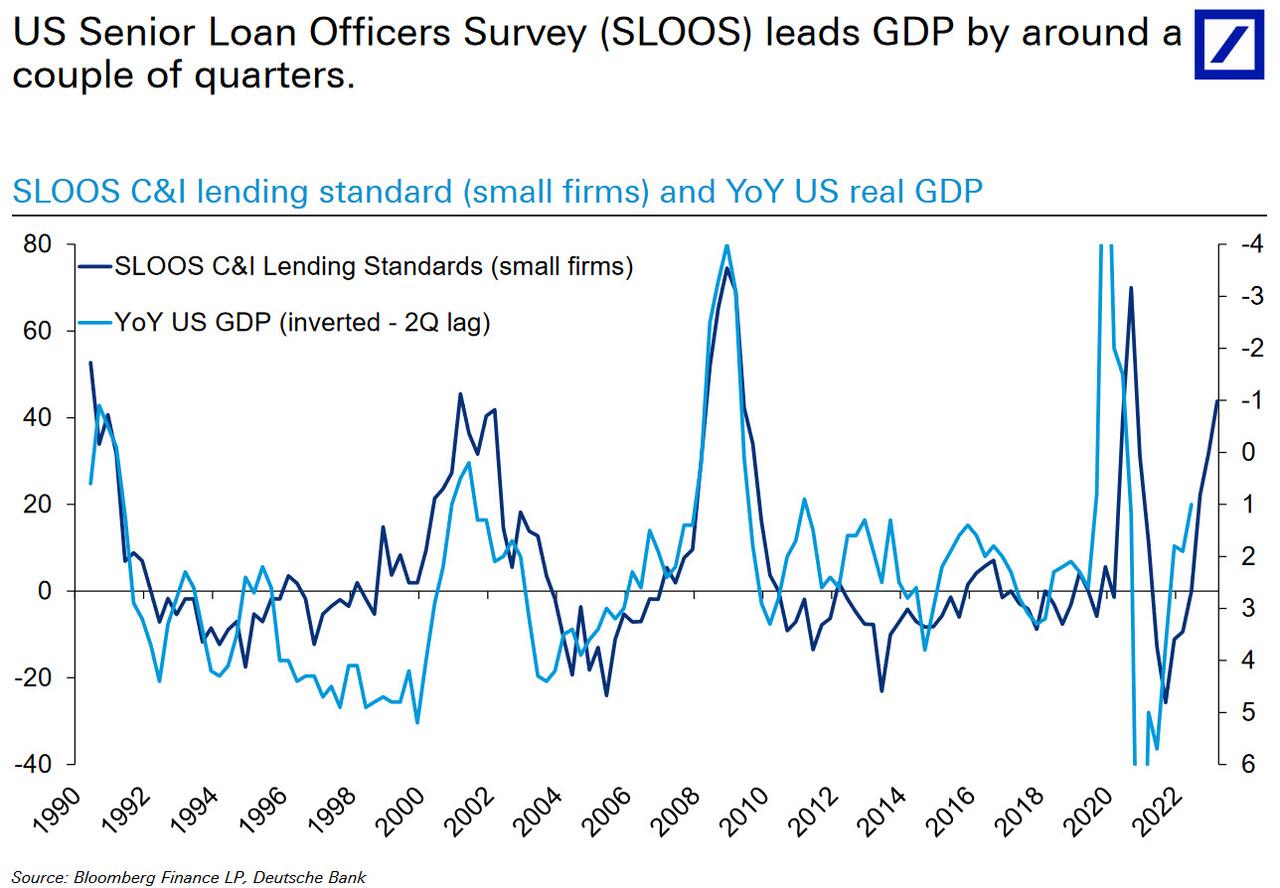
… and leads a surge in HY defaults by around 3 quarters…

To be sure, the banks may not discuss it openly but they are ready: as shown below, we’re halfway between 2007 and 2008 in terms of banks’ forecasting 2023 delinquencies; specifically, US banks forecasting rising 2023 delinquencies is worse than Jan’07 levels.
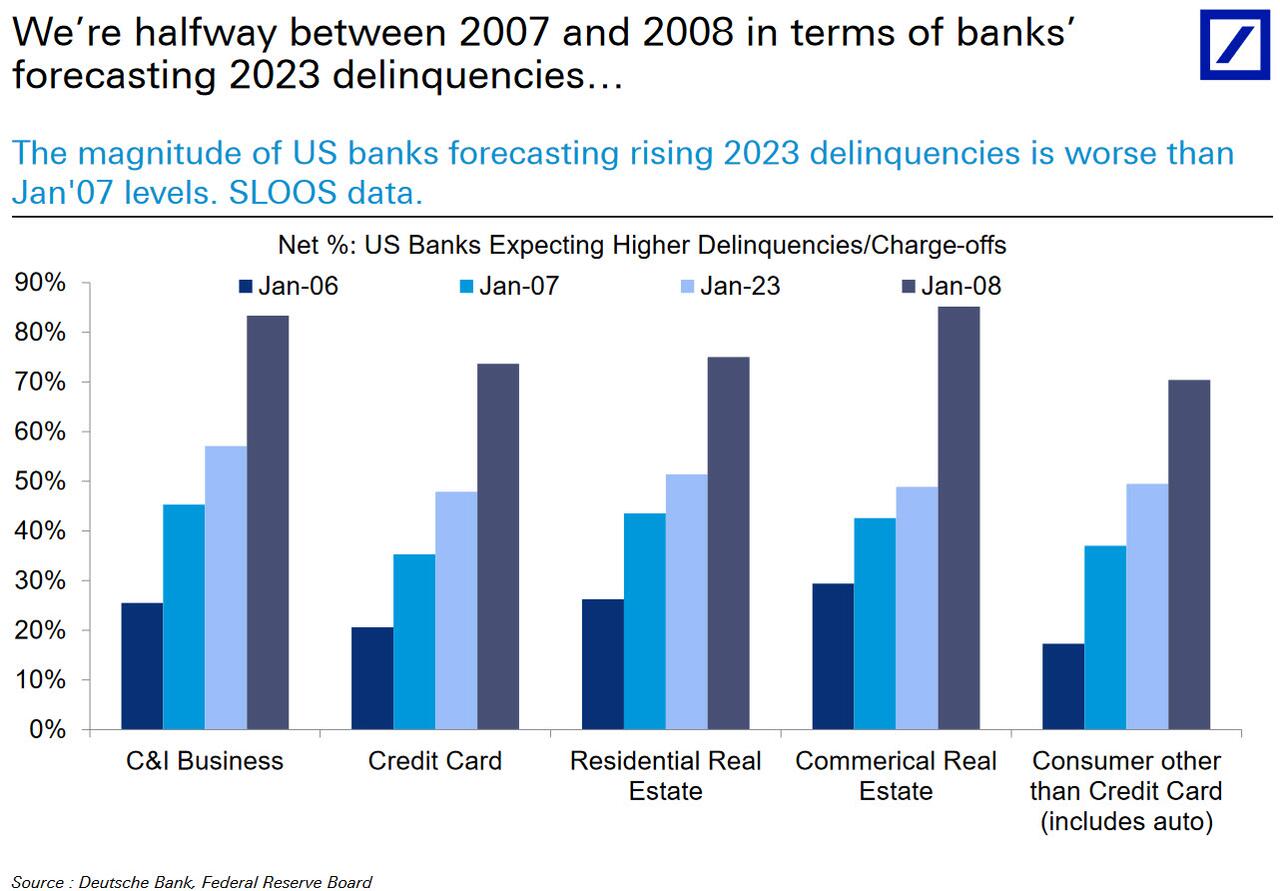
Taking another look at the SLOOS, the survey showed expected delinquencies across a broad range of sectors, which to Reid is “a good correlation to future charge-offs.”
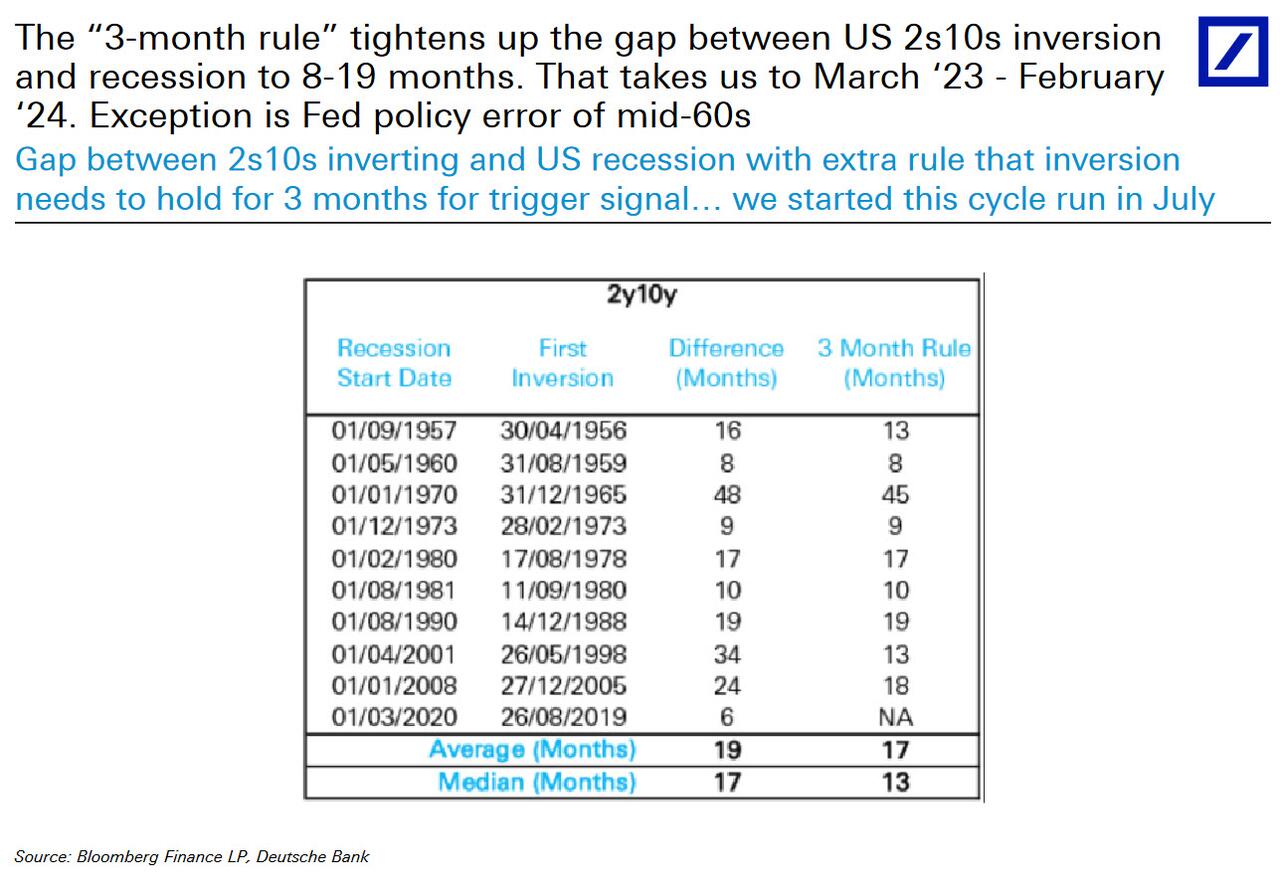
Then there is the yield curve: the 2s10s has inverted before ALL of the last 10 US recessions, and it takes 12-18 months for the lag on average but some cycles take longer….

But here is a way to improve the fit: as Reid notes, the “3-month rule” tightens up the gap between US 2s10s inversion and recession to 8-19 months. That takes us to March ‘23 – February ‘24. The one exception is the Fed policy error of mid-60s.
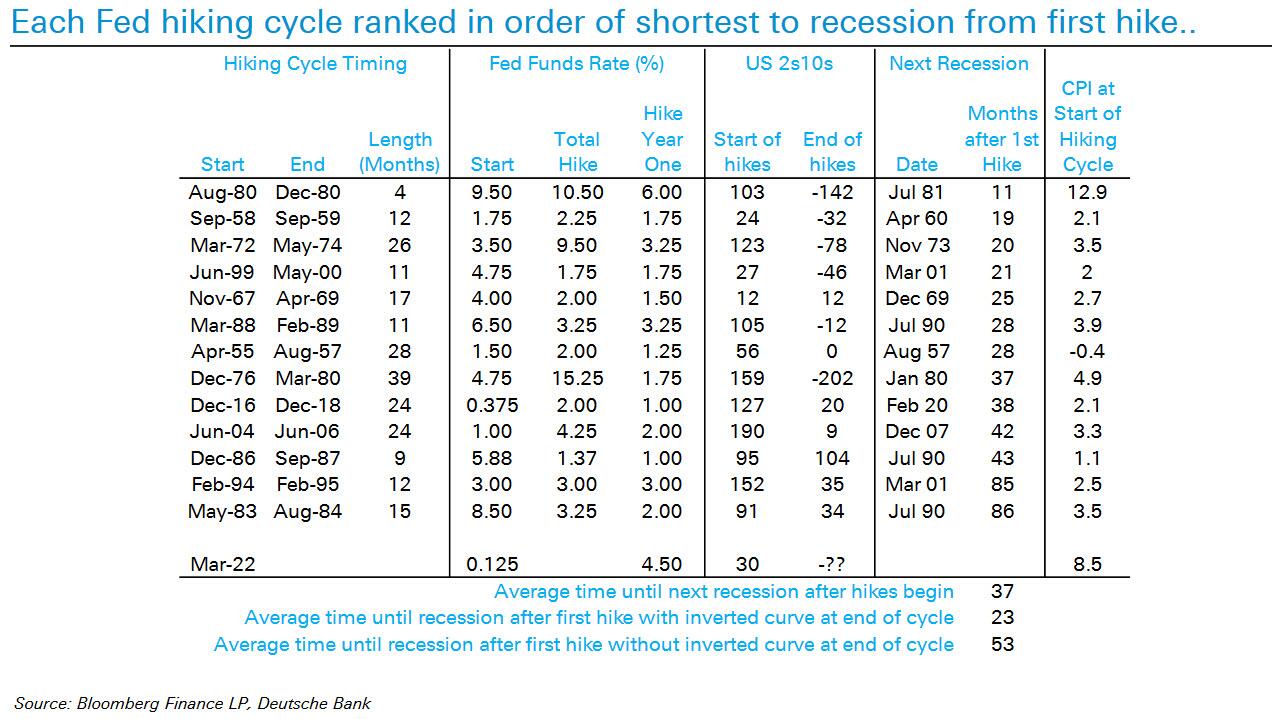
As an aside, Reid believes that Fed hikes to recession and inversion to recession are likely compressed in this cycle: the shortest cycles are very biased to those where the 2s10s curve inverted during the hiking cycle.. The longest cycles tended not to invert the curve during hiking cycles…
Here are some practical consequences of the accelerating rate inversion:
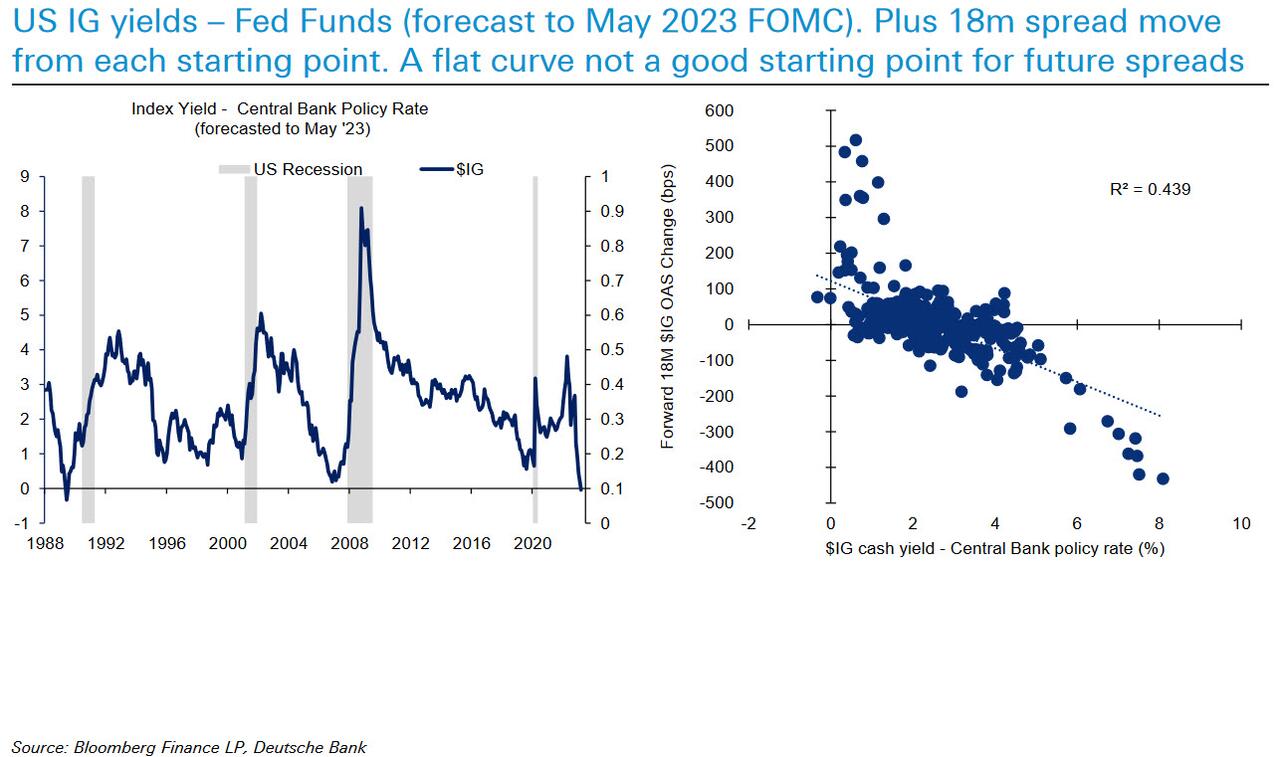
Impact 1. By May US IG (investment grade) should yield same as Fed Funds… “which would you prefer? 11yr credit risk or safe front end risk?”
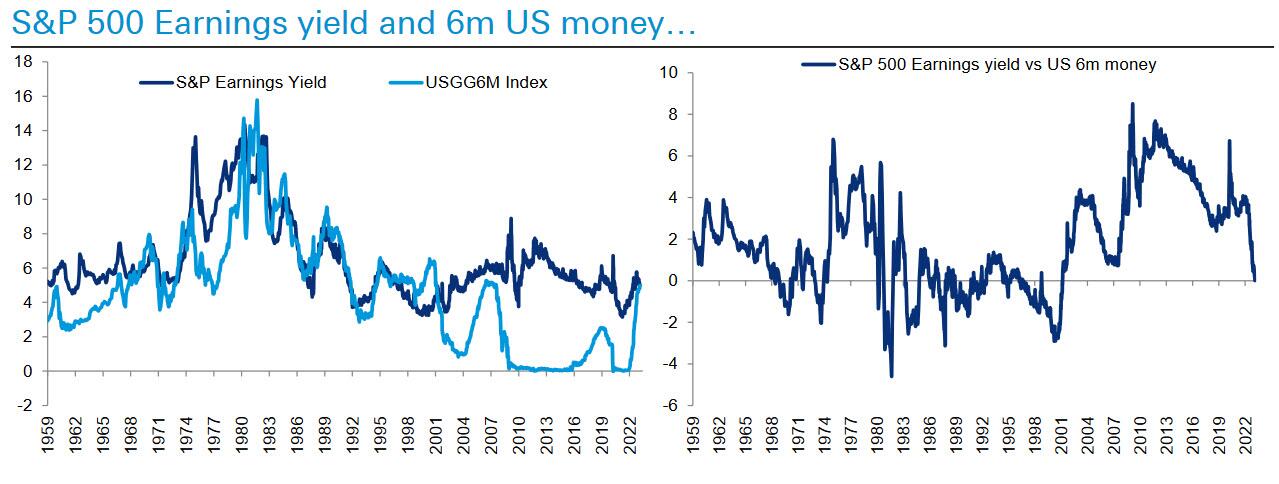
Impact 2: Whether it matters or not is a moot point but it’s striking that 6m US rates matched the earnings yield (1/PE) for the S&P 500 for the first time since 2001 in mid-February
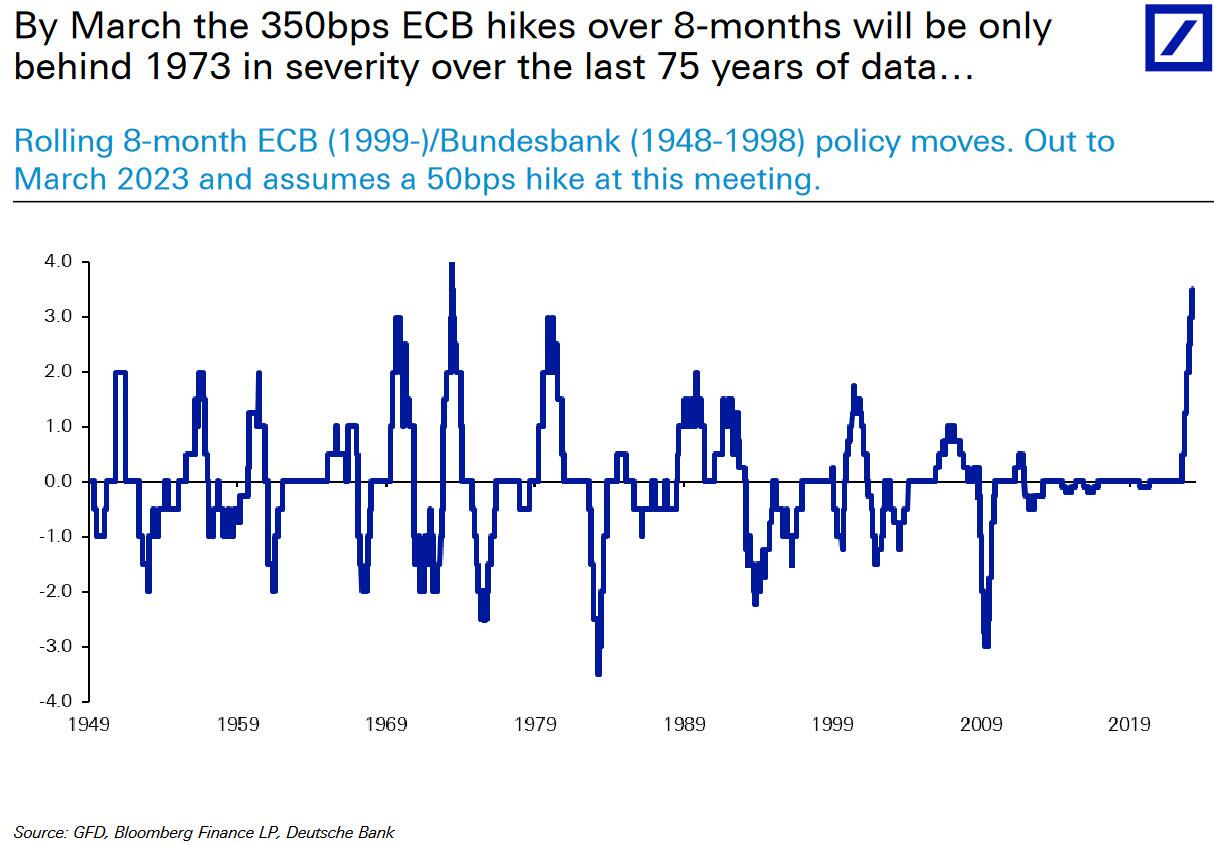
What about Europe, and the ECB, where today’s red hot inflation data moved up expectations for rate hikes to 3.75% by June? According to Reid, the peak impact from ECB hikes will likely be in Q2 2024…
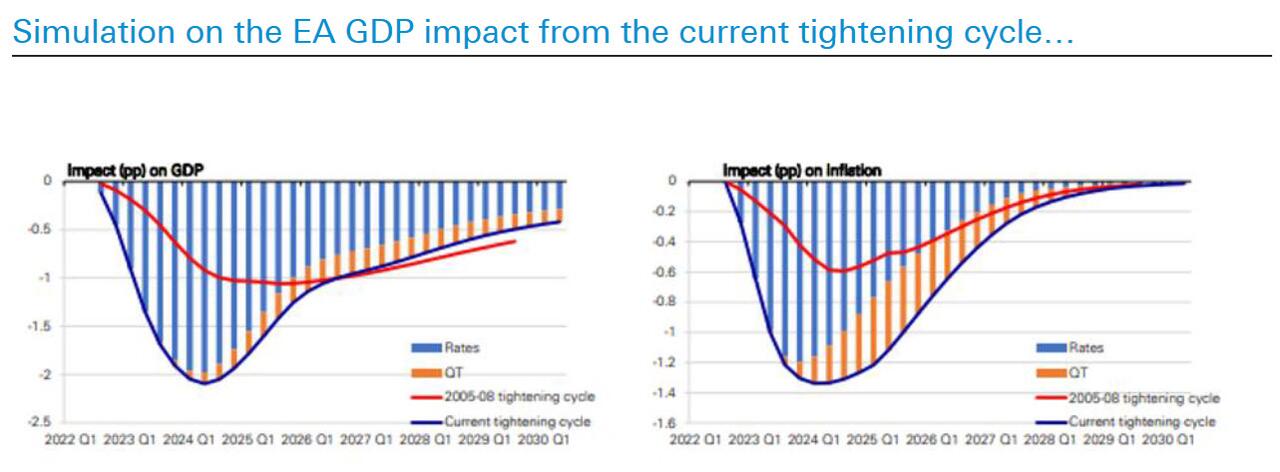
And while lending standard in Europe might ease in Q1 vs. Q4 as war/energy shock dissipate, will the lag of policy then take over?

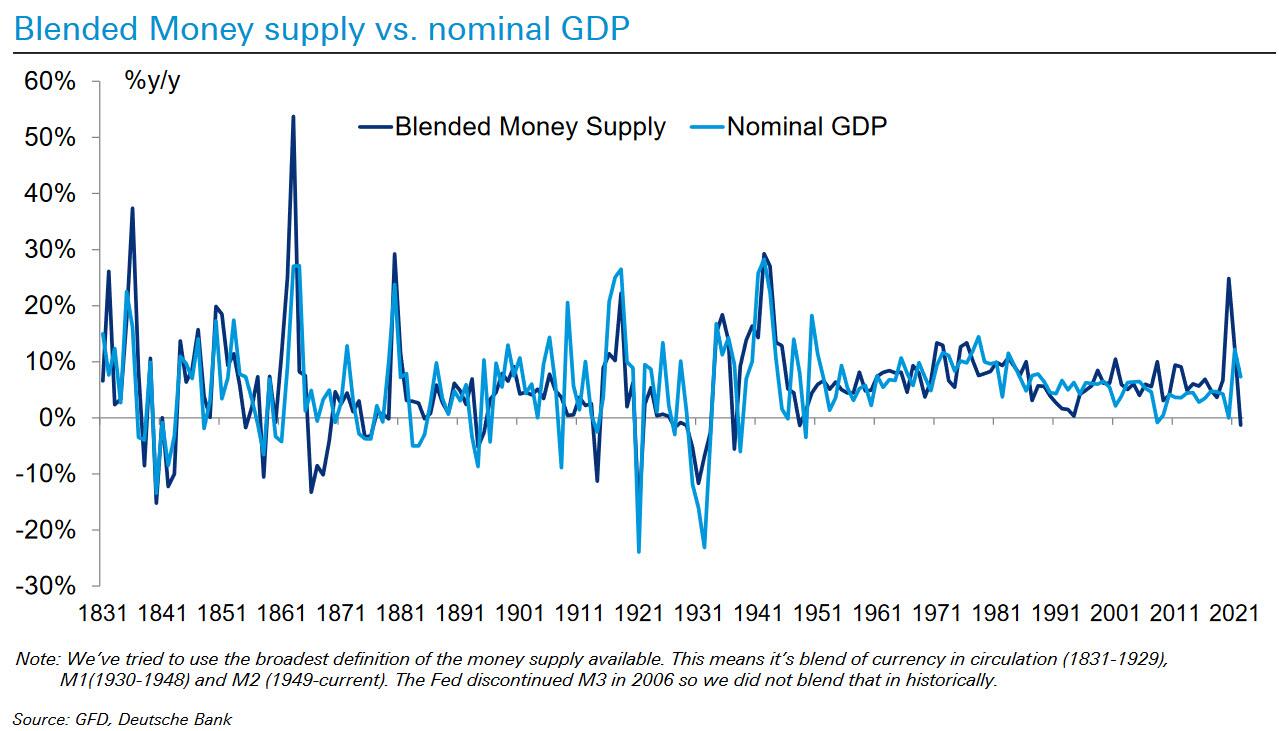
And there there is broad money supply, or M2, which has (very) long and variable lags, and has seen a Boom and Bust in last 3 years: the biggest increase since WWII and now first fall since just after..
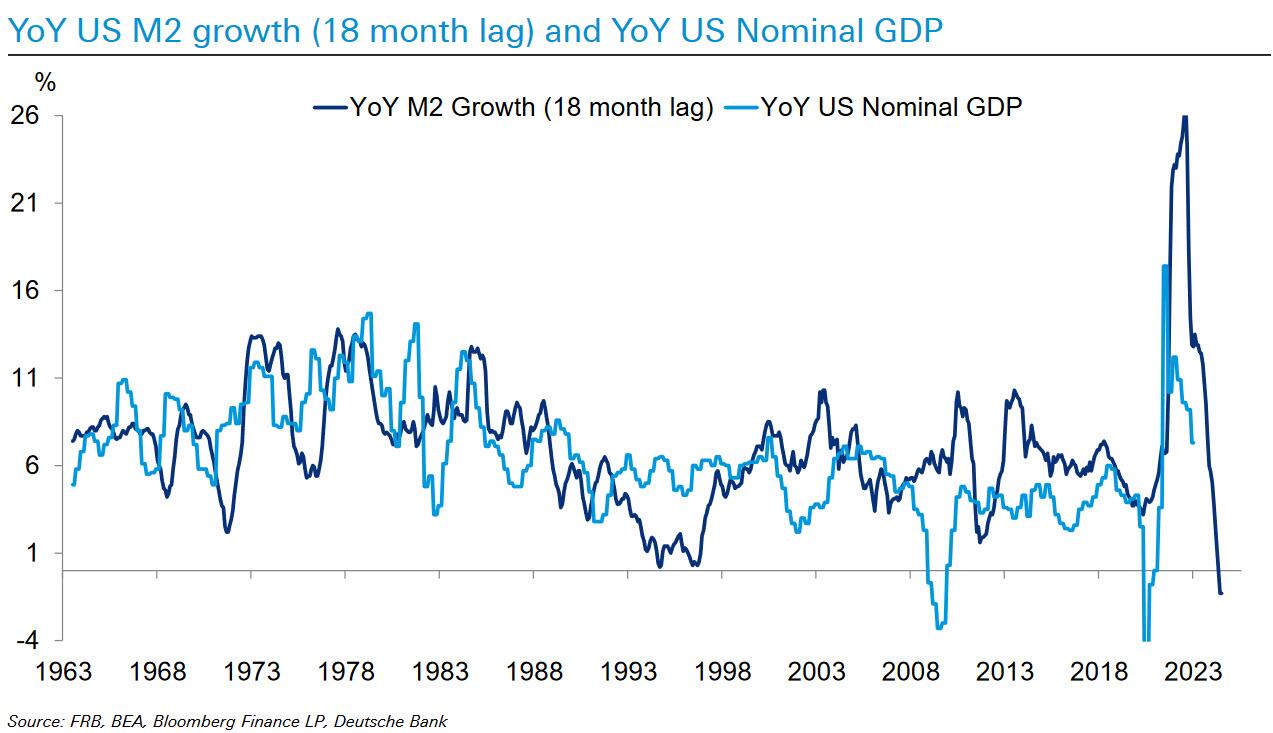
And since over the very long run the two move in tandem, will the fact that M2 YoY is now negative impact growth with a lag? (spoiler alert: yes).
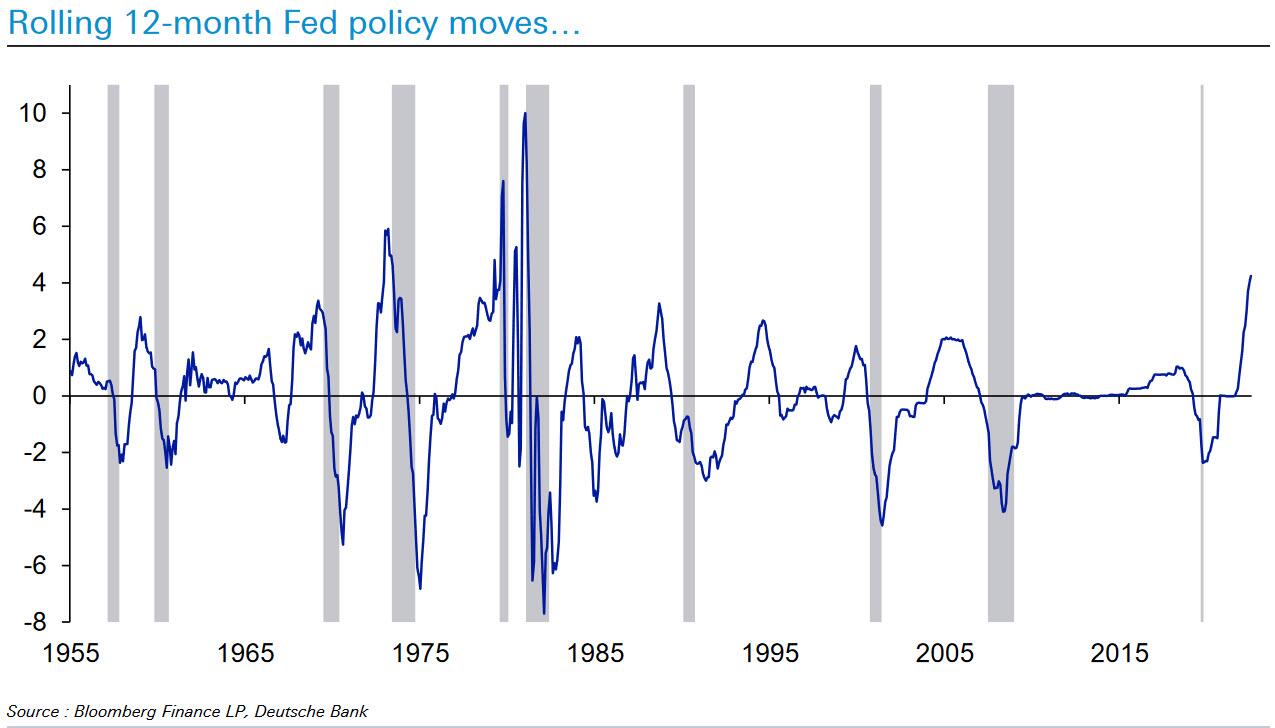
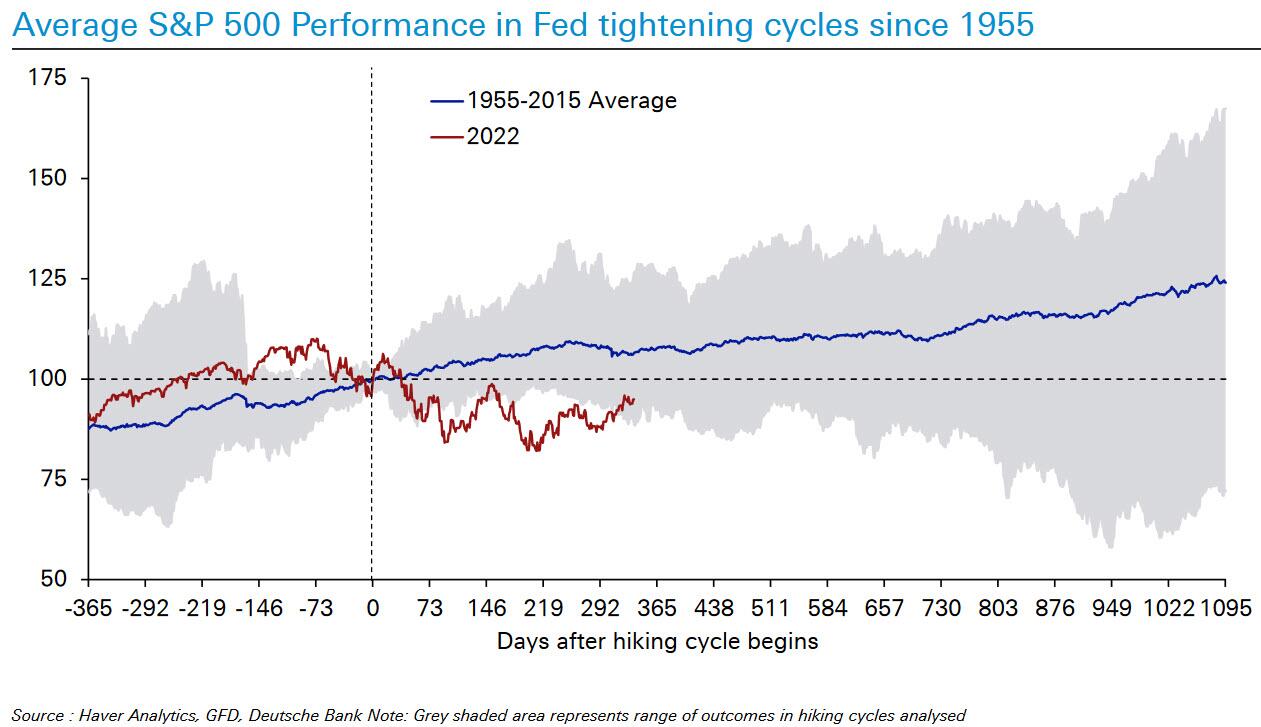
Turning to markets, Reid then shows S&P 500 Performance in Fed Tightening Cycles since 1955 by day: normally the weakness starts to materialize only 9-10 months after the first hike and lasts a year or so, but not this time since the Fed was hiking when the economy and earnings were already slowing; “So either lag is shorter now or we soon move on from the shock of a once in a generation rates move to the economic lag of monetary policy.”
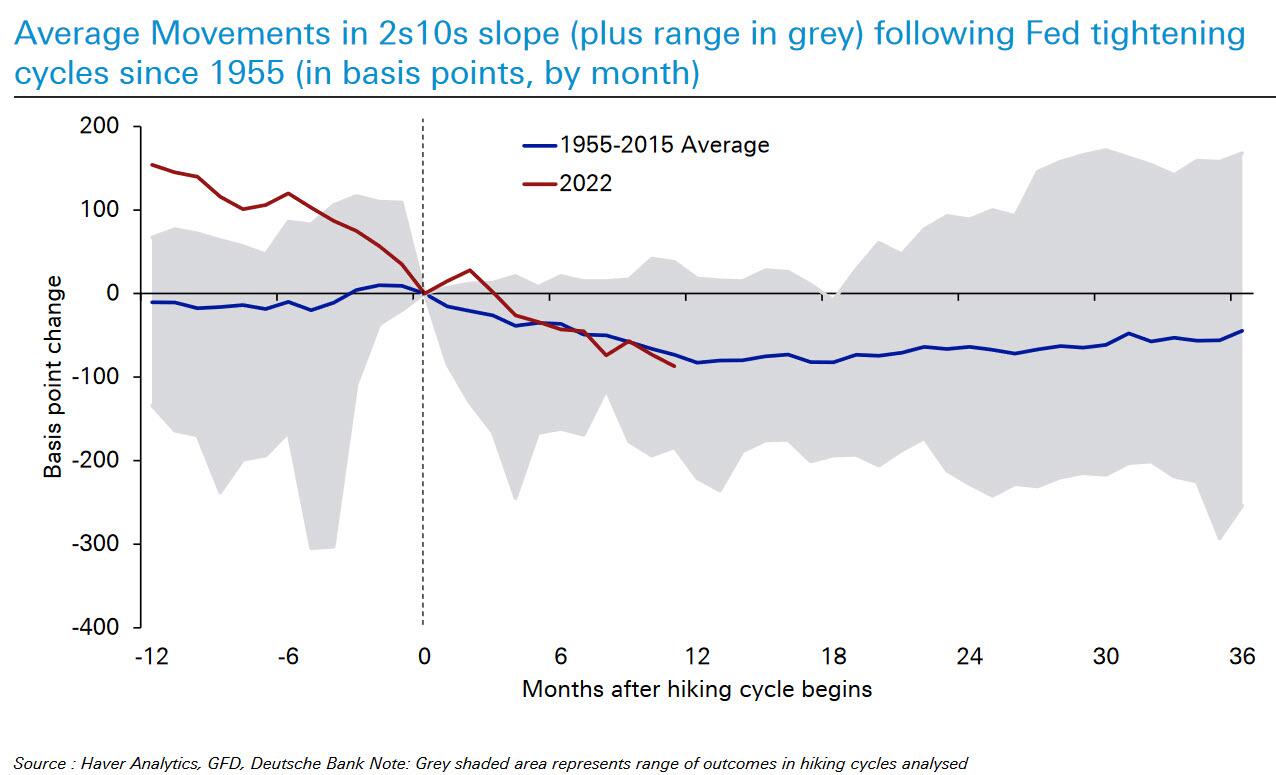
And while equities may diverge from trendline, all is going to script in rates, as shown in the chart of the average movement in 2s10s US yield curve in Fed Tightening Cycles since 1955 by month.
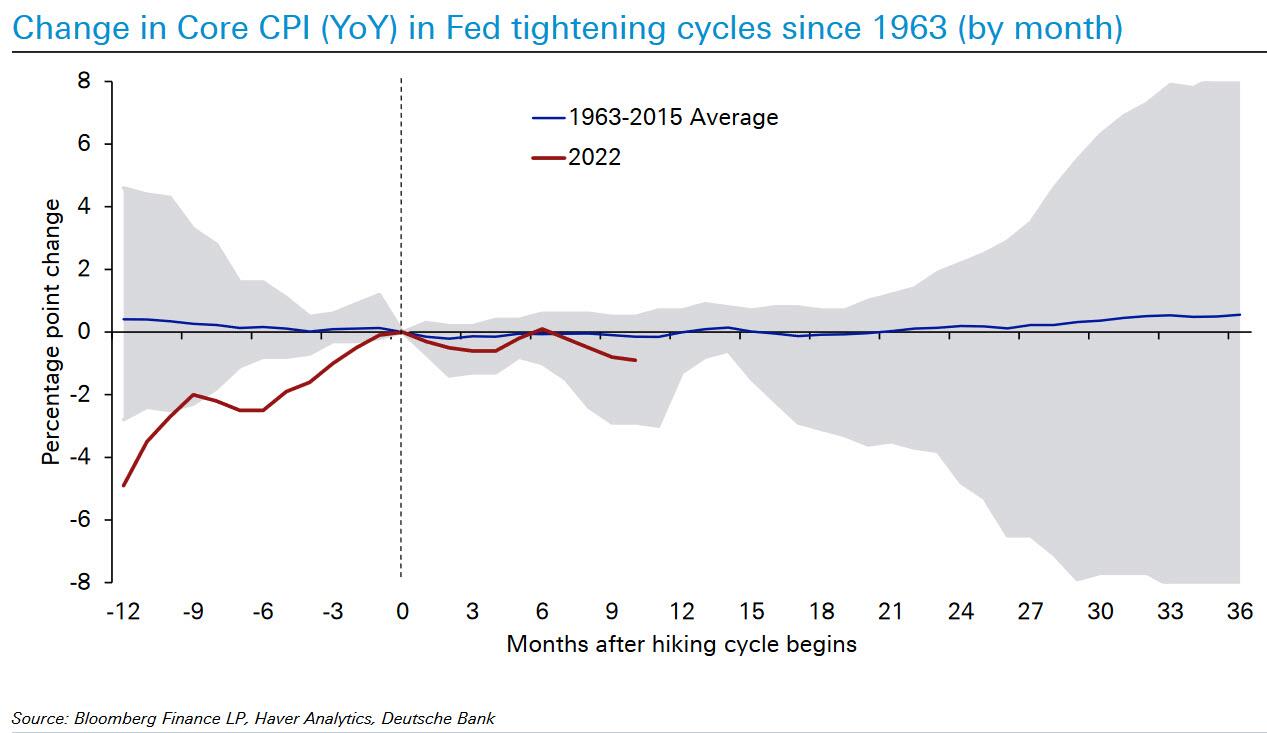
Where there are variations from trendline, is in core CPI, where Core CPI is declining more than the average…
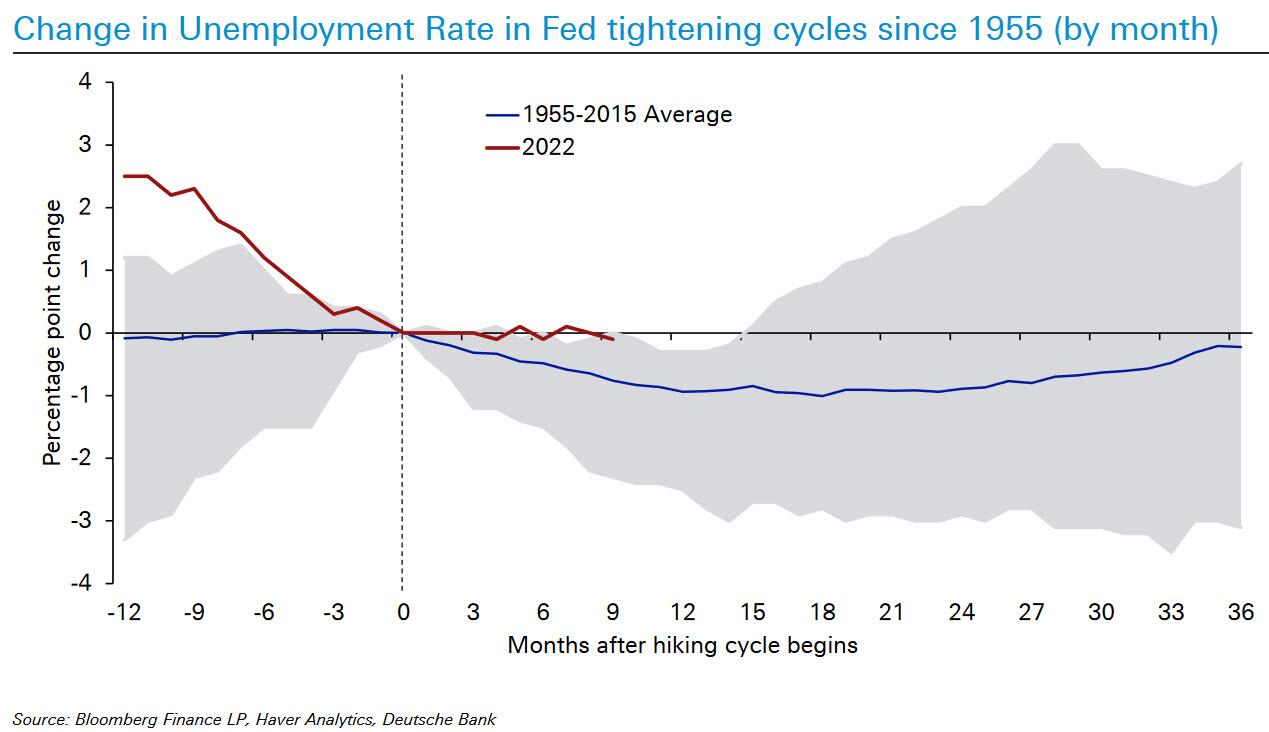
… and unemployment which is notably falling far less than average at this stage, and which “probably reflects a Fed that was well behind the curve…. On average it turns higher 18 months after the Fed starts hiking”
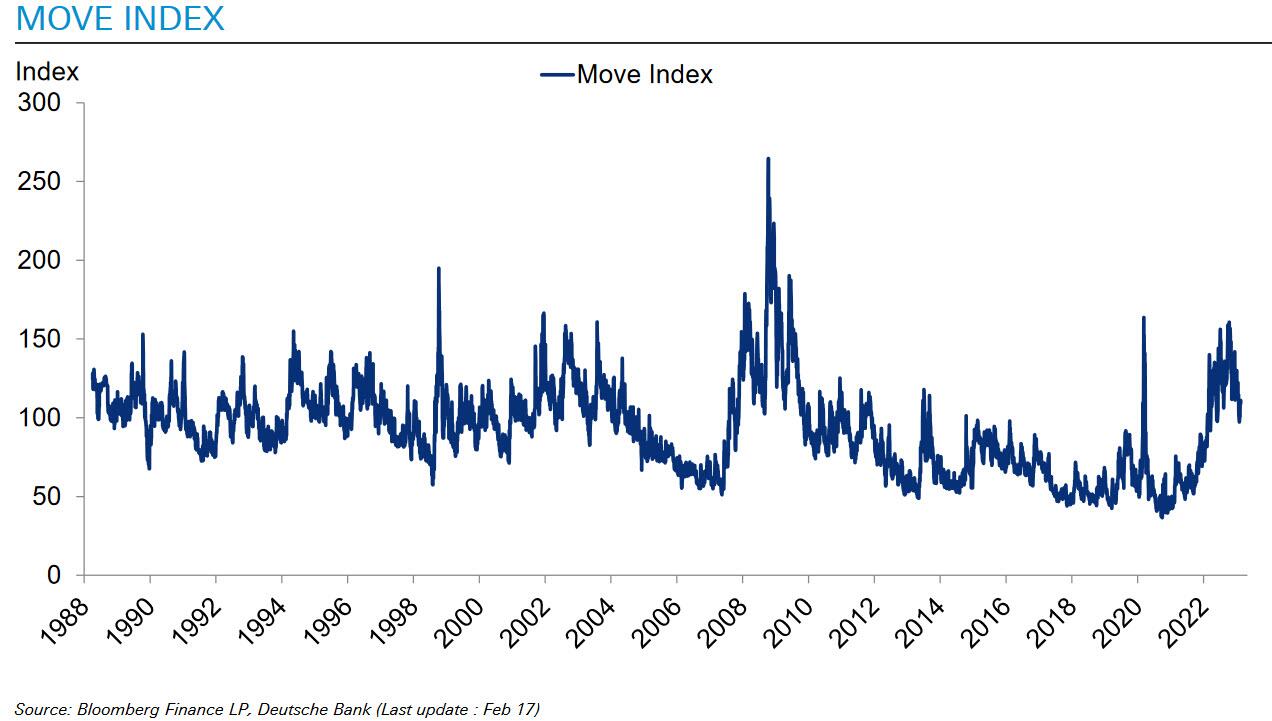
Going back to capital markets, a nagging question: why have risk assets held in as well as they have? For the answer look not to stocks but bonds, and specifically bond volatility (i.e., the MOVE index). As Reid notes, the risk market bottom on October 12th was exactly when the MOVE index reversed from 2009 highs (ex. one day at start of pandemic): the first 9 months of 2022 was a shock after a decade of ultra low rates and lower and lower bond vol.
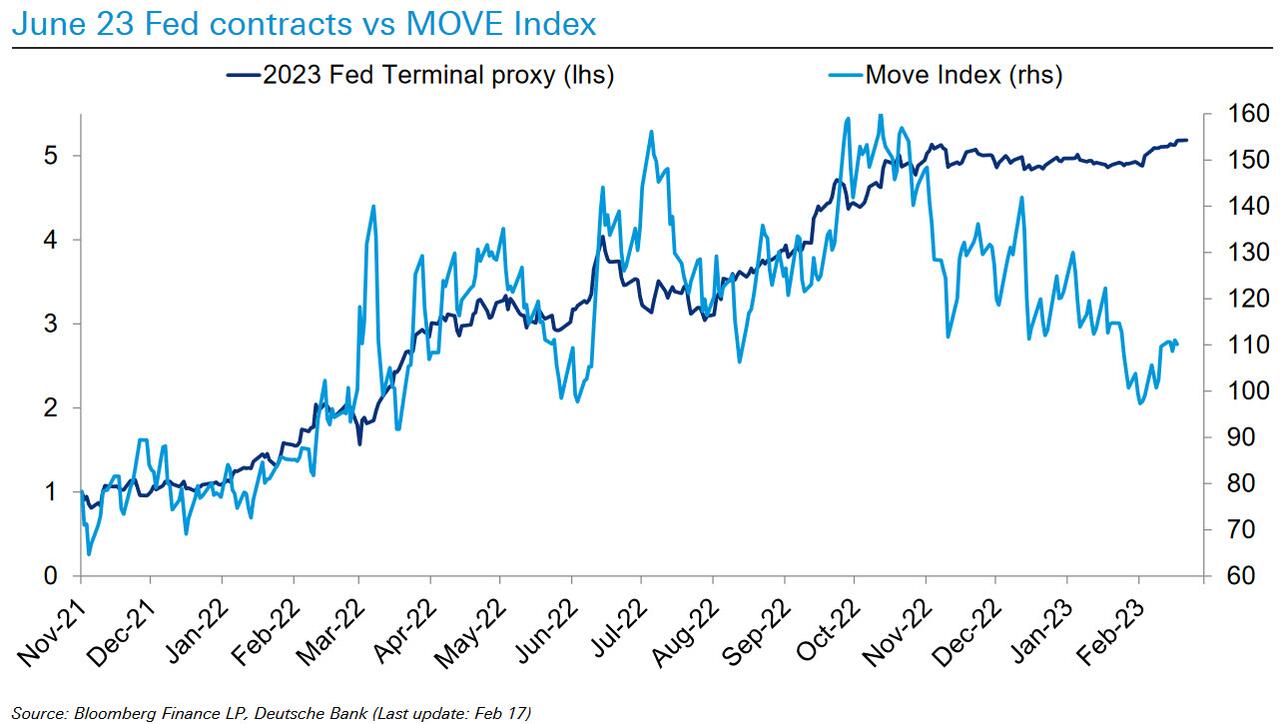
Once Fed Terminal rate assumptions plateaued, rates vol fell sharply… hence the sweet spot between max fears over rates and before lag of policy on economy kicks in. But since the shock payrolls print on Feb 3rd, the terminal rate is edging up again though complicating the picture a bit.
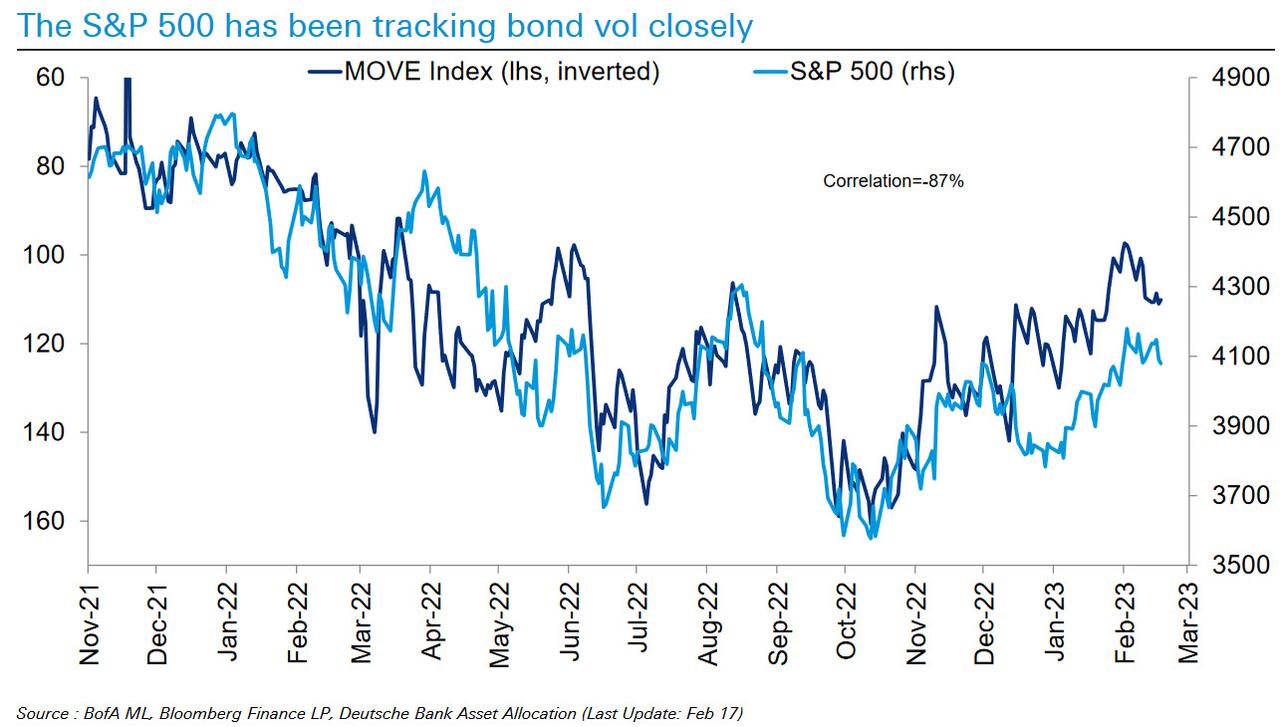
The bottom line is that rates vol has driven equities over last year or so. Rates vol falling since March has been a support for equities but when the recession comes this correlation will break down…
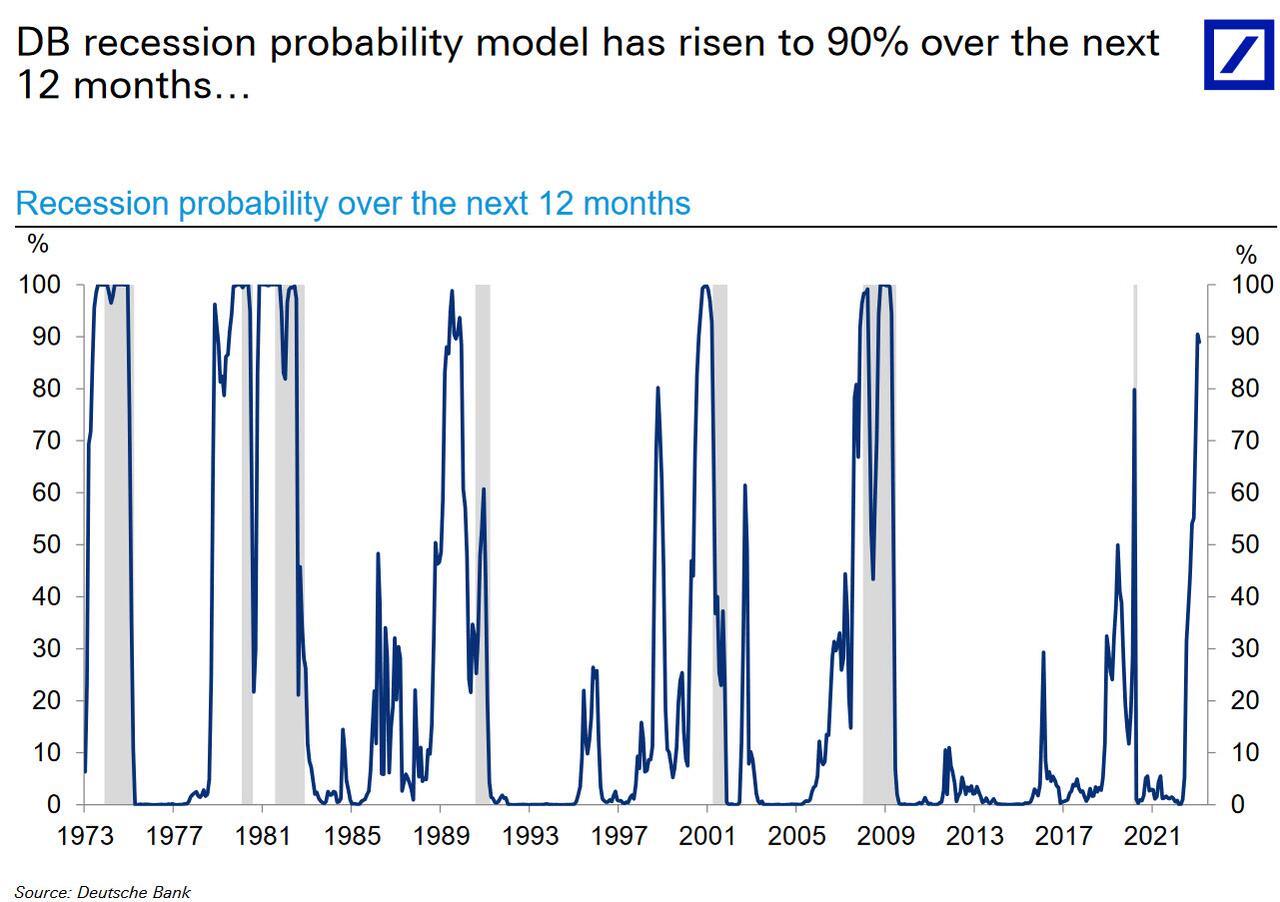
Finally, some hard landing slides. First, Reid notes that DB’s recession probability model has risen to 90% over the next 12 months (on the other end, Goldman sees recession odds at 25% over the next year).
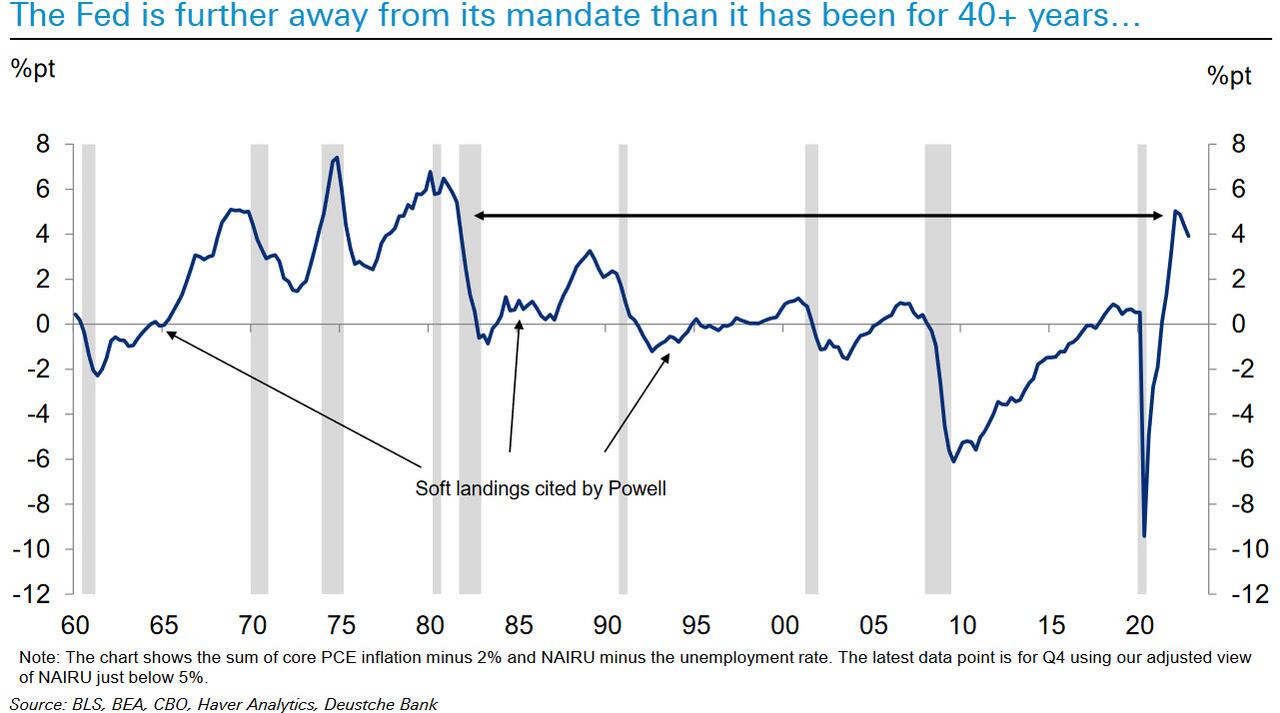
Why note a soft landing? Take one look at the Fed Misery Index: according to Reid, soft landings have only occurred in hiking cycles where the Fed was around its mandate (unlike now).
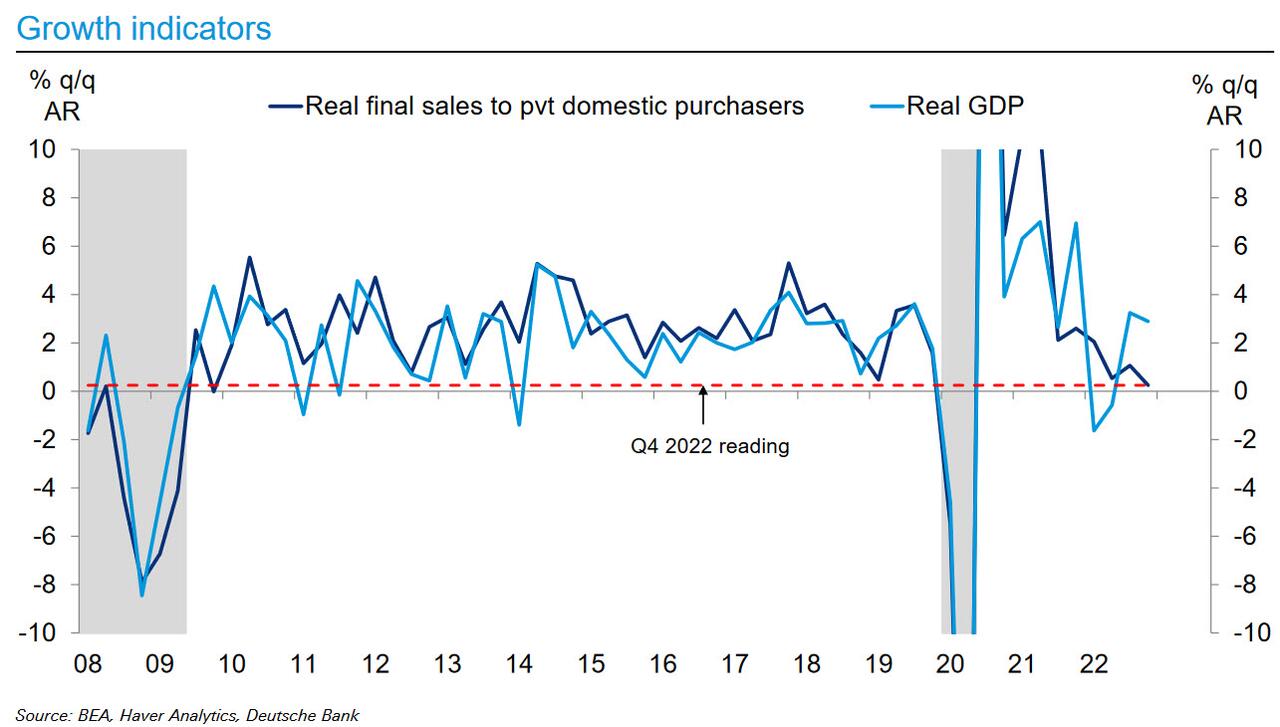
And then there is the actual weakness in the economy with trend growth rapidly weakening. As noted in the last GDP report, we are seeing the softest growth in final sales to private domestic purchasers since GFC (ex-Covid).
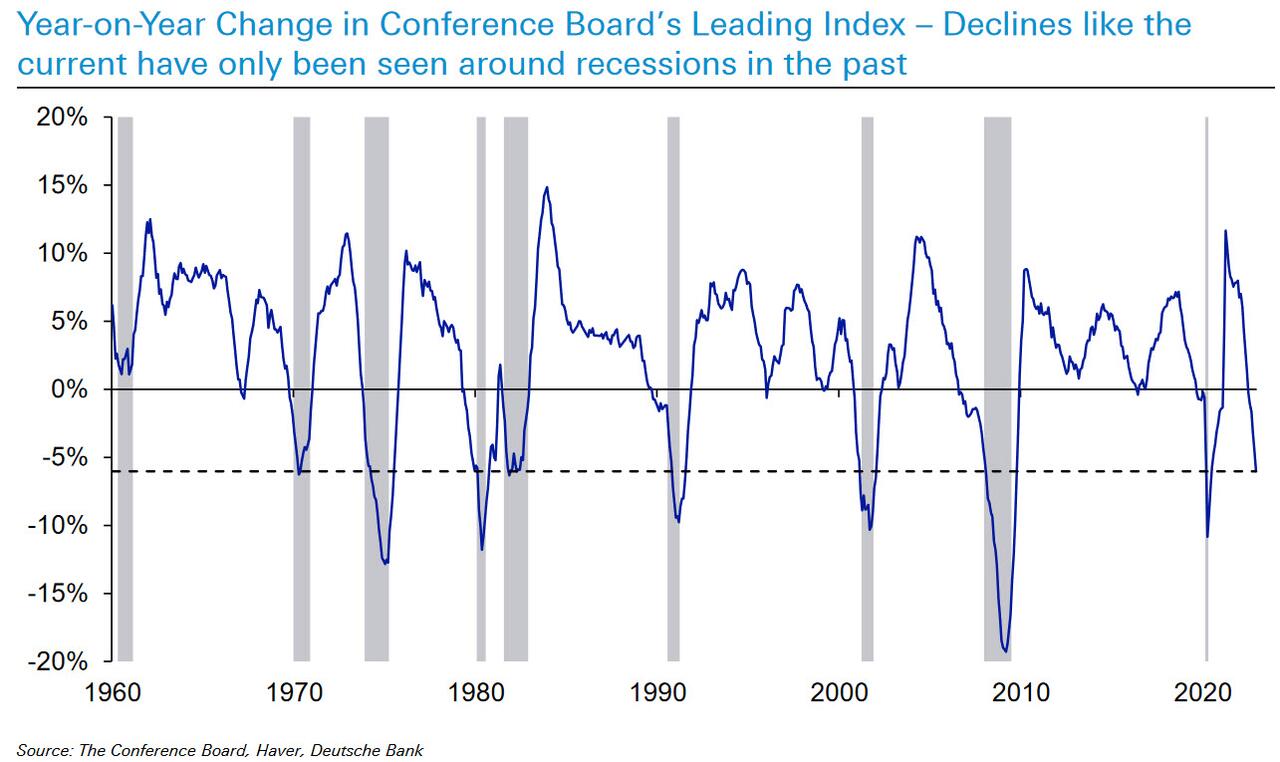
… or the Leading Index: anything more than a -1% YoY decline in US LEI has always led to a US recession within a few months. We’re now at -6% YoY
There are similar observations to be made regaring declines in the US new Mfg orders, the Philly Fed index (another one in the camp of “never been this bad without a recession swiftly following”), and others, but understandably all eyes remain glued to the surprising strength in jobs. And understandably so… but as shown below, that can and will change furiously and on a dime: in the next chart, Reid shows that US unemployment barely budges between recession (R) minus 6 months and R minus 1 month…. and then surges in the recession.
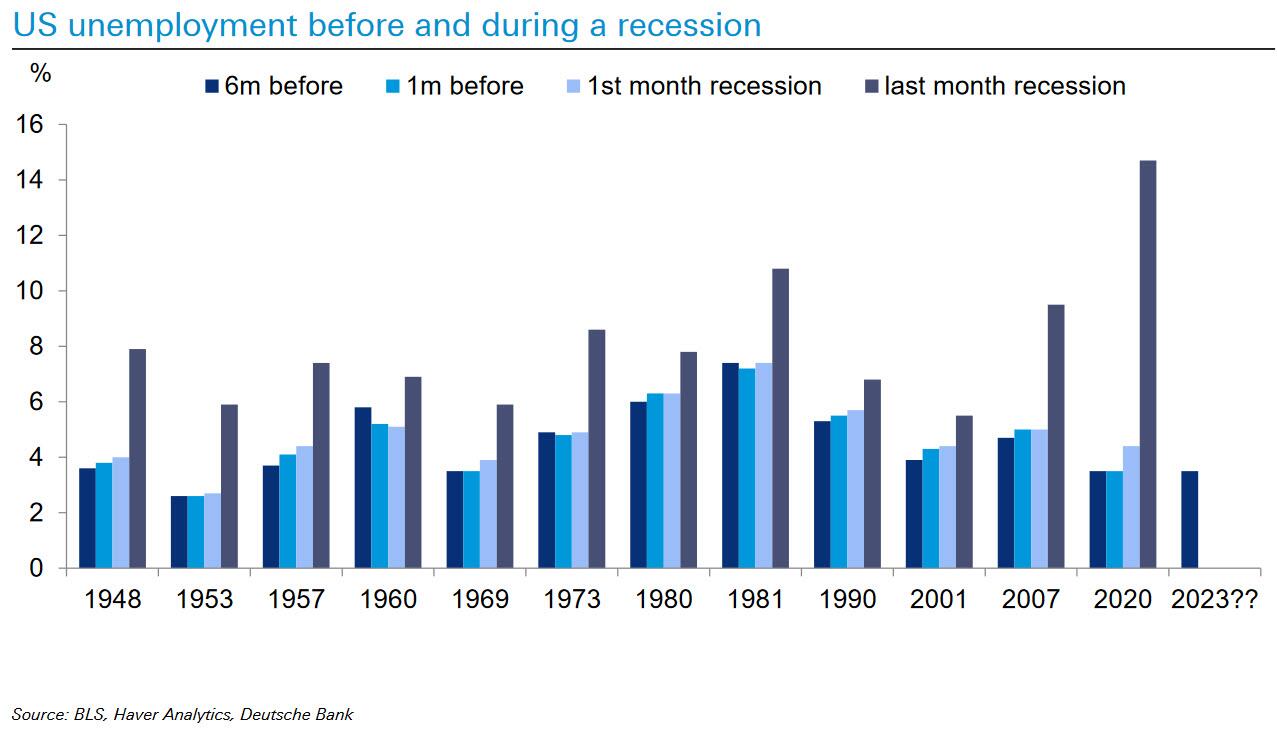
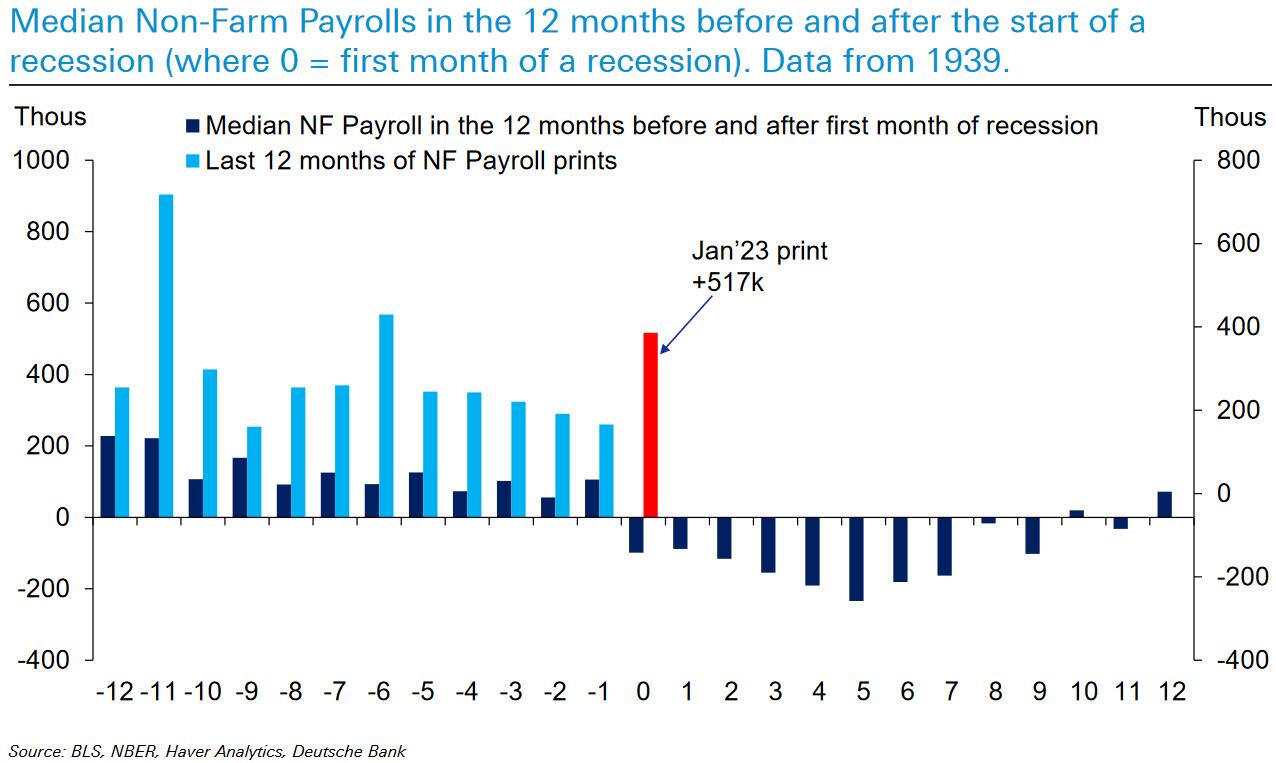
Finally, while payrolls don’t suggest we’re in recession now – not by a long stretch – look at the non-linearity when the recession hits shown by Reid in the chart below: a sharp fall with little warning… this is especially true as we wait to see how much of Jan 23’s gains were seasonals.
The irony here is that not just stock markets (or at least the bulls) are hoping the recession starts as soon as possible: the Fed does too, as it can finally go back to what it does best and brrrrrr. The only question is whether anyone in the Biden admin realizes that hopes of perpetuating the growth fallacy into 2024 – a key election year – will end in disaster, and it behooves the president to push the economy over the cliff now rather than wait…