Uddrag fra kommentator John Authers:
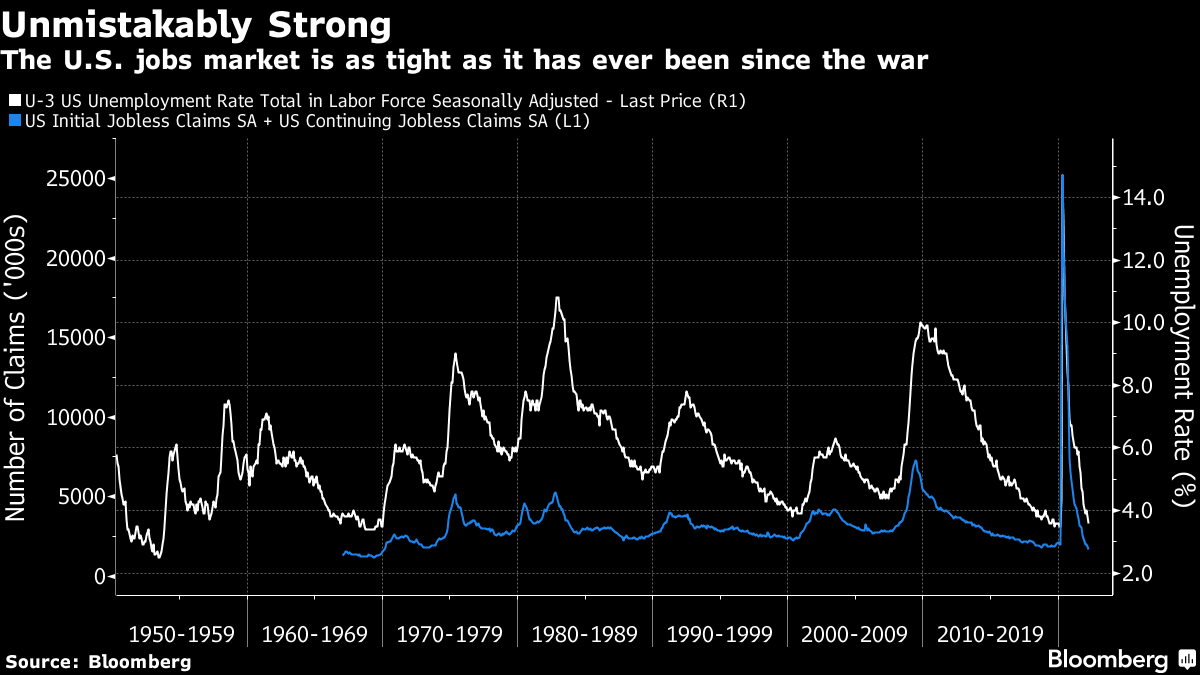
- Why is there so much talk of recession when fewer people are claiming unemployment insurance in the U.S. than at all other times since 1970?
The American labor market could scarcely be any stronger. The unemployment rate has tumbled far faster than the most optimistic predictions. Workers have so much negotiating power that there is now even a unionized Amazon.com Inc. depot:
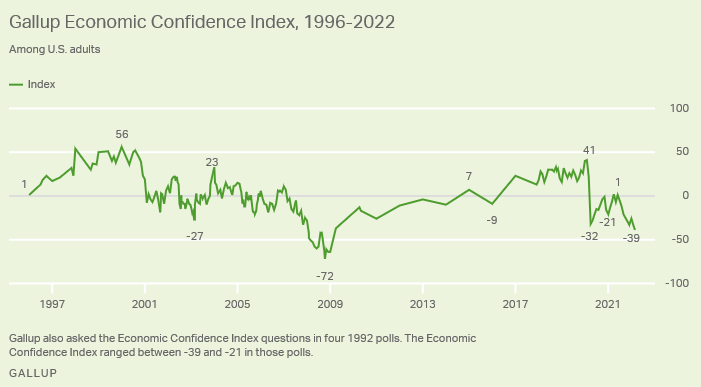
There is widespread confidence that the pandemic is over (justified or otherwise). And yet economic confidence among U.S. adults is almost its lowest in a quarter-century, according to an ongoing Gallup poll. The excess of those thinking the economy was going the wrong way over those believing it was headed in the right direction had only previously been greater during the worst of the Global Financial Crisis in late 2008. Pessimism is more intense even than during the worst of the Covid shutdown two years ago:
One obvious reason for the negativity is inflation. Prices are rising faster than anyone much under the age of 50 can recall. Rising costs of living attack confidence, while falling real wages are a counterweight to stronger employment.
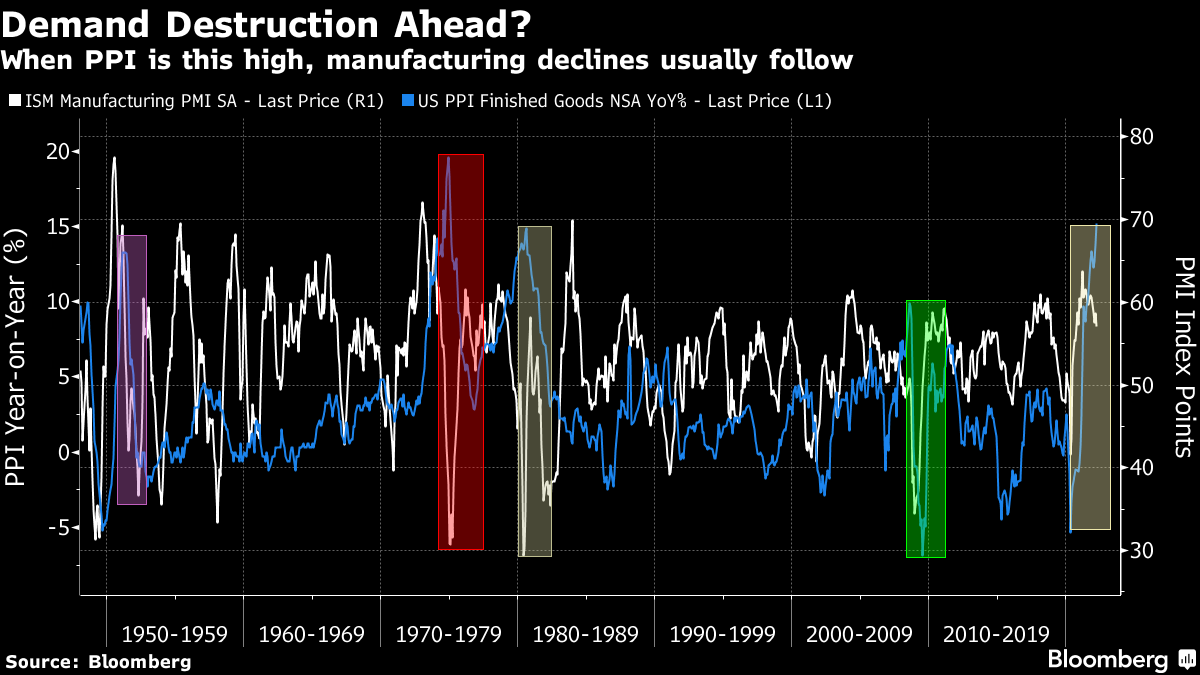
Beyond pure sentiment, inflation is reaching a point where it’s sensible to ask whether it could force an economic slowdown. Last month, the Ukraine conflict helped force an increase for the ages in industrial costs. On a finished goods basis, producer price inflation has been calculated ever since 1948. In all that time, it has only once run faster than in March of this year. This is mostly about fuel costs, but even a “core” PPI is the highest in 40 years:
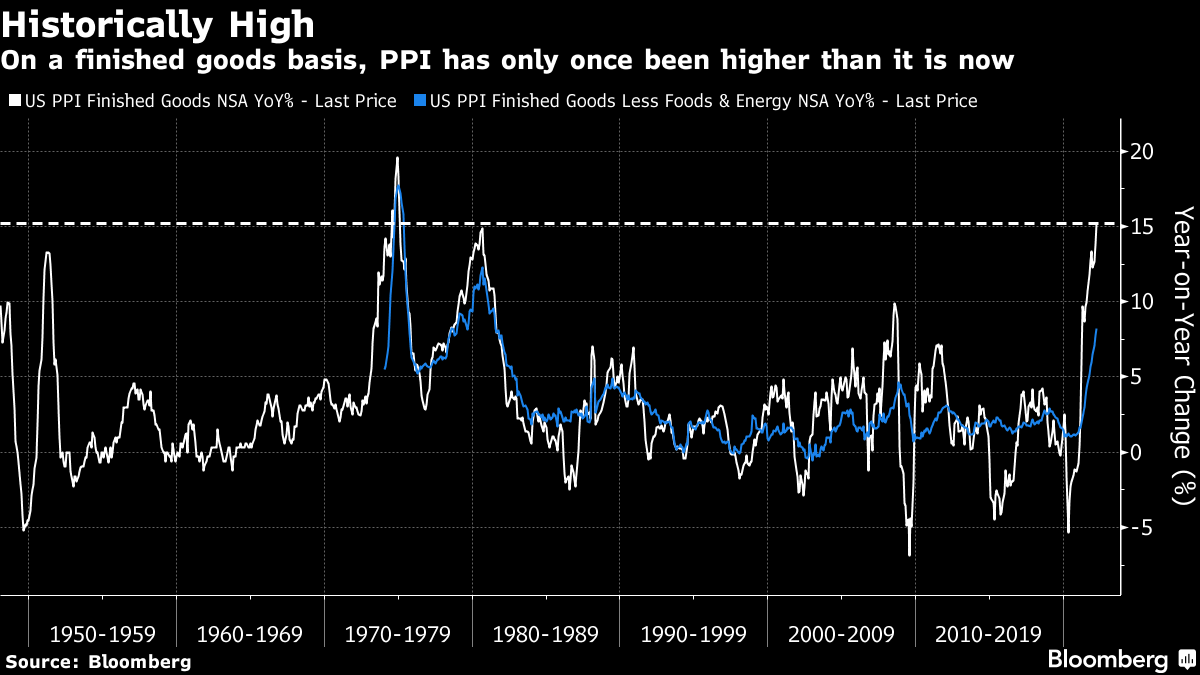
In conditions this disturbing, it’s not surprising that people aren’t confident. Looking at the chart, however, one clear message is that if PPI breaks into double figures, it seldom stays there very long. Even in the stagflationary 1970s, PPI ran at a single-figure rate most of the the time. So the good news is that we can expect producer price inflation to fall very soon.
The bad news is that this is because such high inflation will cause demand destruction, and choke off industrial activity. The PMI survey of manufacturing purchasing managers goes back as far as the PPI data. Looking back, every time PPI spikes the way it’s surging now, the PMI drops into a recessionary territory swiftly thereafter. The incidences of this are marked with rectangles:
There is another way high inflation turns into an economic slowdown — by pushing the central bank to drive up interest rates and squeeze life out of the economy. The bond market has a classic way to signal when this is going to happen, the infamous inverted yield curve. If 10-year yields are lower than two-year or three-month bond yields, it’s a sign that the Fed is predicted to hike rates too far in the short term, and drive a slowdown that requires the central bank to lower them again.
Last month, the most commonly followed yield curve, the gap between two- and 10-year yields, inverted after a swift flattening. Then strong guidance that the Fed would be embarking on QT — quantitative tightening, or selling some of its massive stock of bonds to push up their yield — helped the curve steepen once more. Meanwhile, the spread of the 10-year over the three-month yield has actually widened this year:

As the chart suggests, this is a strange set of circumstances, which has arisen because the Fed is so far behind the curve. The official fed funds rate has only just started to rise, but traders now expect another two percentage points of hikes within the next year. Thus the gap between the three-month and the two-year suddenly widens.
Generally, the 2-10 is more closely watched, but the 3-month-10 is a more foolproof recession indicator and tends only to invert very soon before the economy heads south, As the chart shows, this yield curve sent an emphatic signal of an oncoming recession in the summer of 2019, while the 2-10 curve only momentarily inverted. To interpret what these contradictory signals portend for the economy, the risk of a recession a year or so hence is obviously rising, but the chance that the Fed is able to push up longer yields as well, and then head off inflation, means that a recession isn’t a given. It’s probably best to summarize the signals as warning of a recession before long, as a result of current overheating, but not of an imminent slump.
If people feel like diving into risk assets and betting that they can get out before the top, it looks as though this could be the time to give it a try. But it’s a dangerous game.
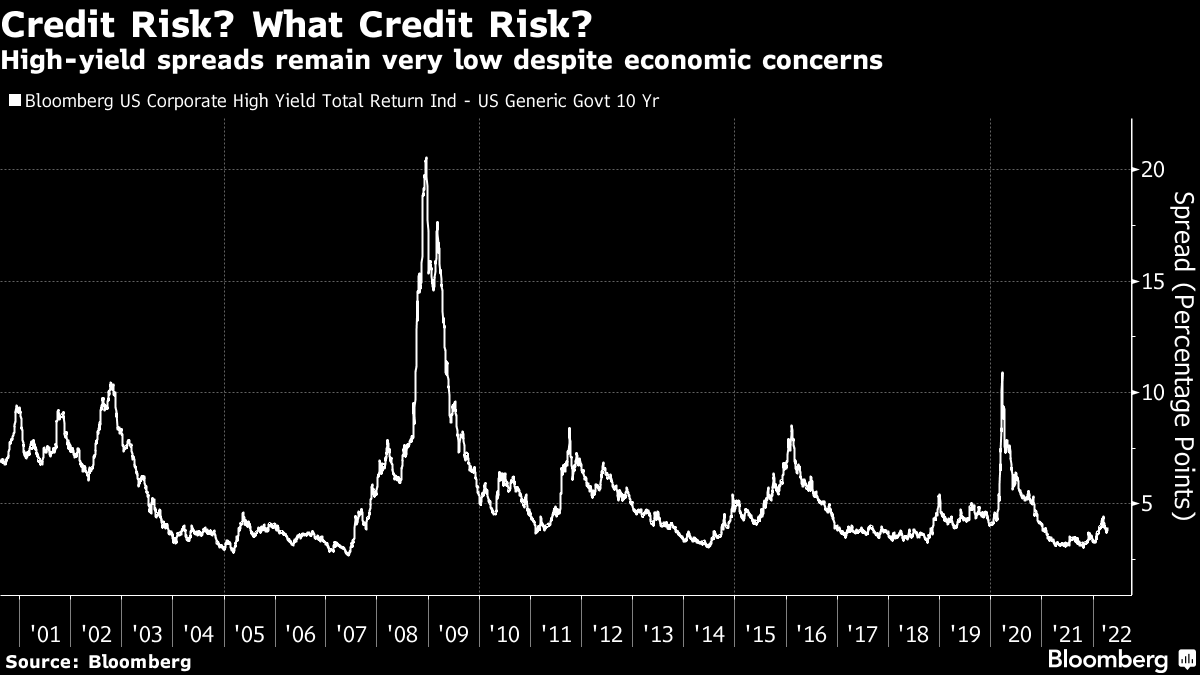
- Why are corporate credit spreads so tight when at all other times that interest rates are rising, they have widened?
This is very strange. When other indicators are signaling recession risks, and particularly when Treasury yields are rising, you would expect the extra spread of high-yield bonds issued by more speculative companies to go up. The last similar spike in bond yields, in the summer of 2007, provoked a rise in spreads that started the descent into the credit crisis. But this time around, spreads have scarcely budged:
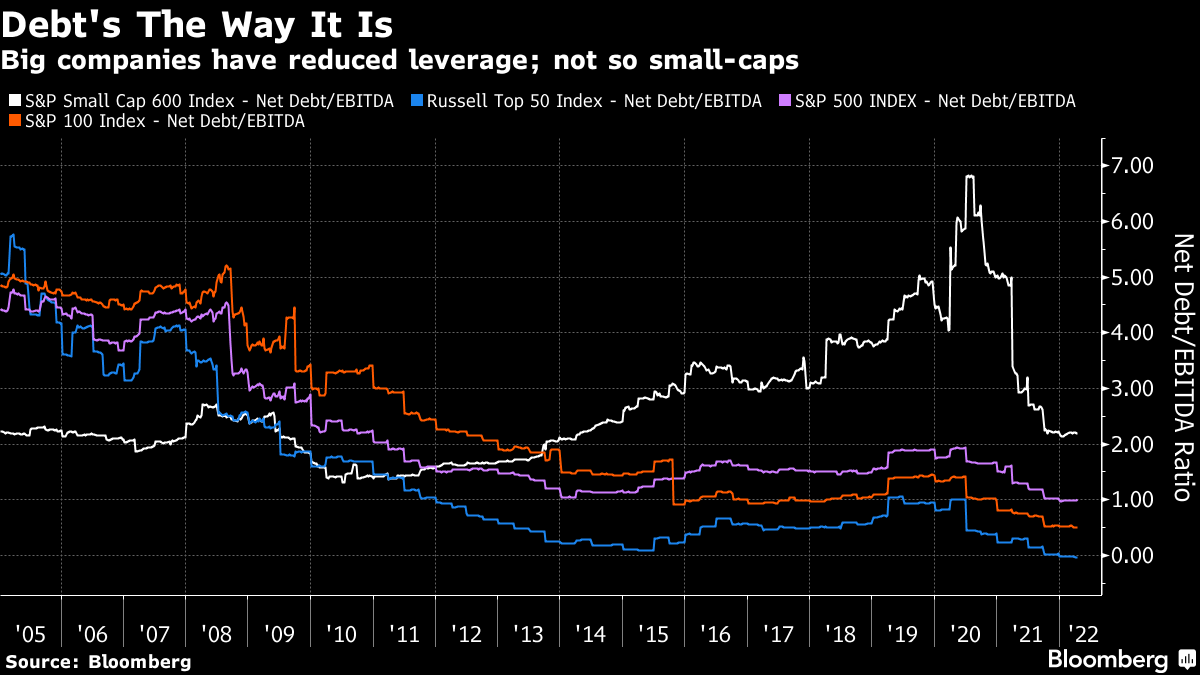
Why are investors more comfortable this time? One reason is that Corporate USA has spent the post-crisis era deleveraging. Entering 2008, larger U.S. companies were heavily leveraged — more so than smaller companies. Now, as the chart shows, that has turned around. If measured by net debt’s ratio to earnings before interest, tax, depreciation and amortization, a gauge of how long it will take a company to pay off its debts with profits, then the biggest U.S. companies, in the Russell Top 50, now have negative net debt. The S&P 100, which includes the next 50 companies down on the list, and the S&P 500 have strengthened their balance sheets at a similar rate. Meanwhile, the smaller companies of the S&P 600 have gone in the opposite direction, using post-crisis cheap debt to lever up. The speed with which they’ve brought leverage under control since the pandemic might help explain why credit investors aren’t too concerned:
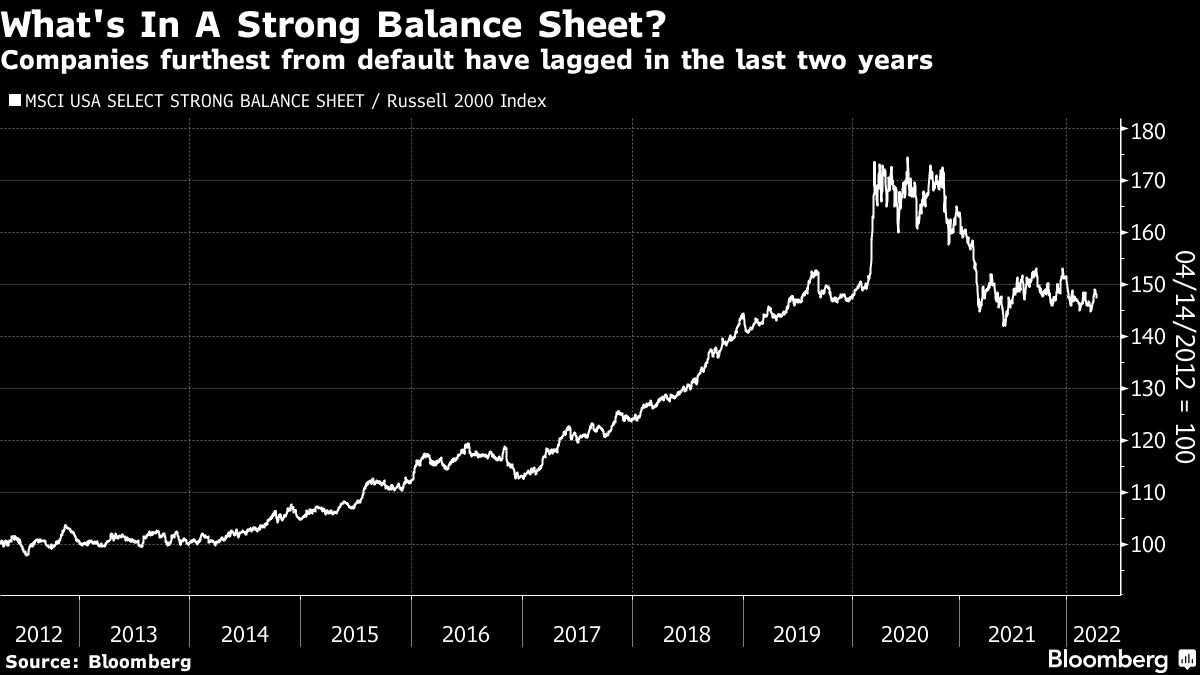
Looking at the way the equity market is handling the issue of balance sheet strength reveals a contradictory picture. The MSCI USA Select Strong Balance Sheet index, designed by the quantitative team at Societe Generale SA, outperformed the Russell 2000 index of smaller companies reliably for years leading up to the pandemic, when strong balance sheets suddenly became more attractive. Over the last two years, however, the market has stopped rewarding companies for strong balance sheets, even though it looks as though they could soon become very useful indeed:
The quants at Barclays PLC have indexes for companies with weak and strong balance sheets, however, which suggests that even if there’s no great reward for a strong balance sheet, they’re beginning to punish companies for a weak one. Weak balance sheet stocks have sharply lagged more robust companies over the last 12 months:
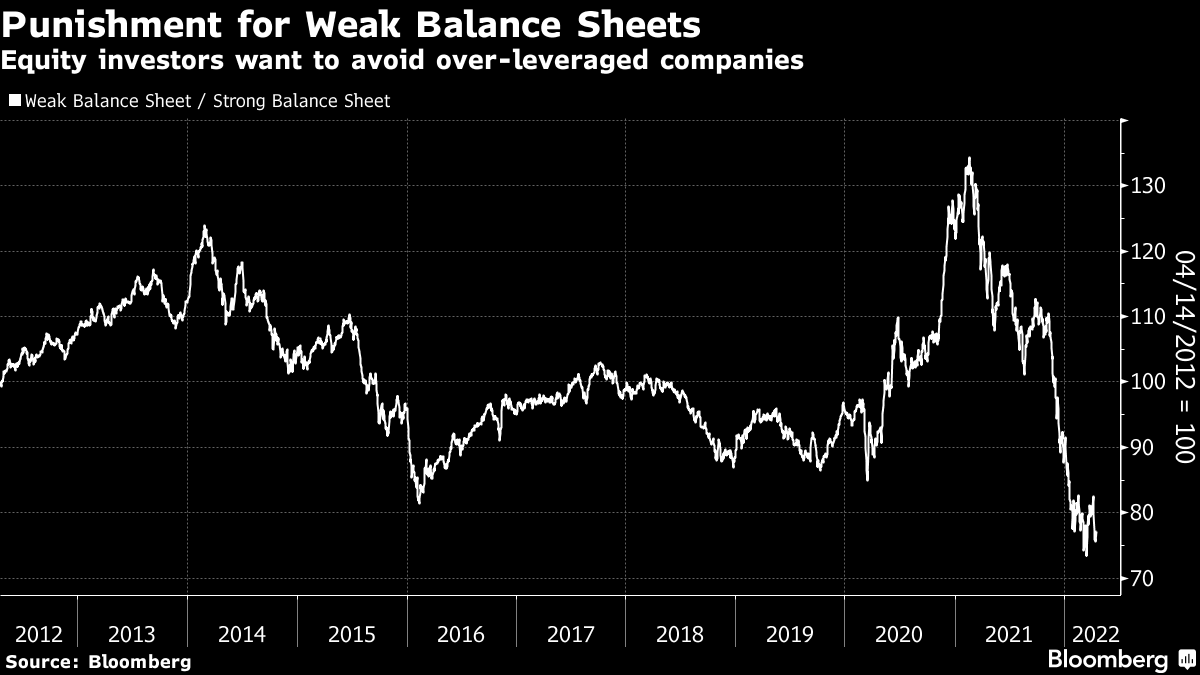
So there is growing nervousness among equity investors about heavily indebted companies, but bondholders are still relatively comfortable. It remains very strange that the credit market hasn’t adjust more as the rates position has darkened.
- Why are emerging markets investments performing so badly when at all other times, strong commodity prices have helped them?
Commodity pries are surging in what looks very much like a new bull market. That should mean good things for emerging markets, which for this century have risen and fallen with prices of natural resources. But the relationship has broken completely:
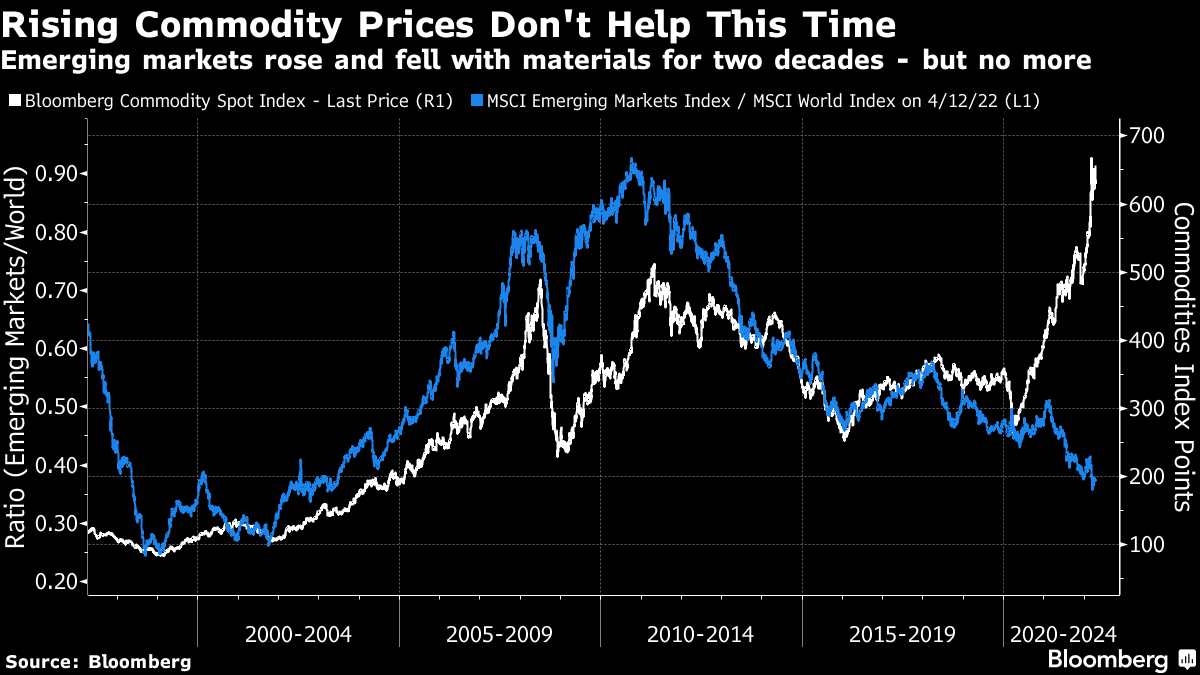
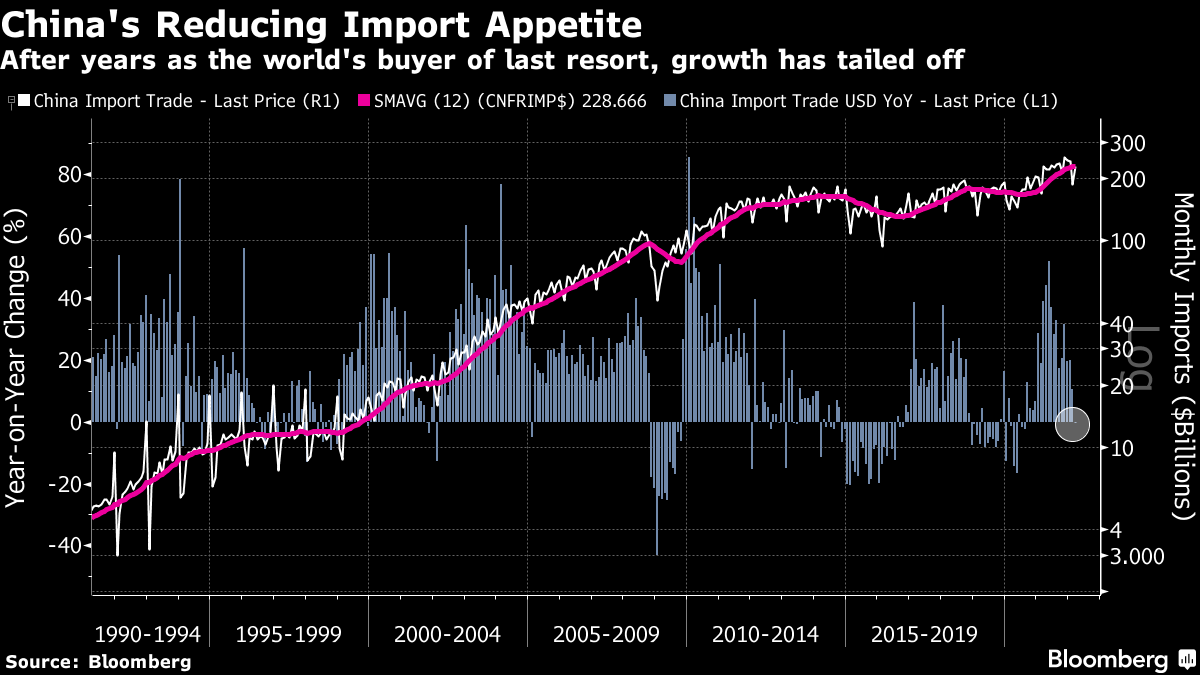
How to explain this? As ever, all roads lead to China. First, this commodity boom is due chiefly to constricted supply, rather than to growing demand like the last one. Chinese imports have stopped increasing at their remarkable rate of the 1990s and 2000s. That boom was about the emergence of China and the strength that came with it for the rest of the emerging world. This one is something different:
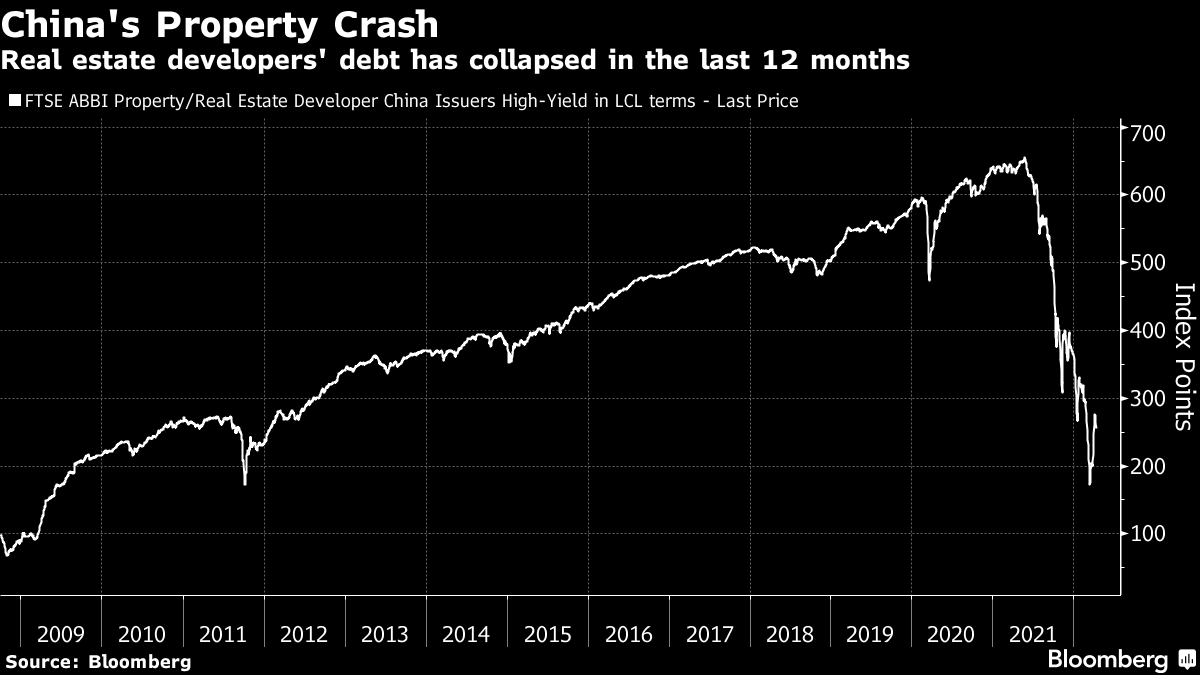
Meanwhile, the long-feared crash in China’s over-leveraged property sector appears to be happening. Bonds of property developers have bounced a little but are still worth less than half of what they were a year ago:
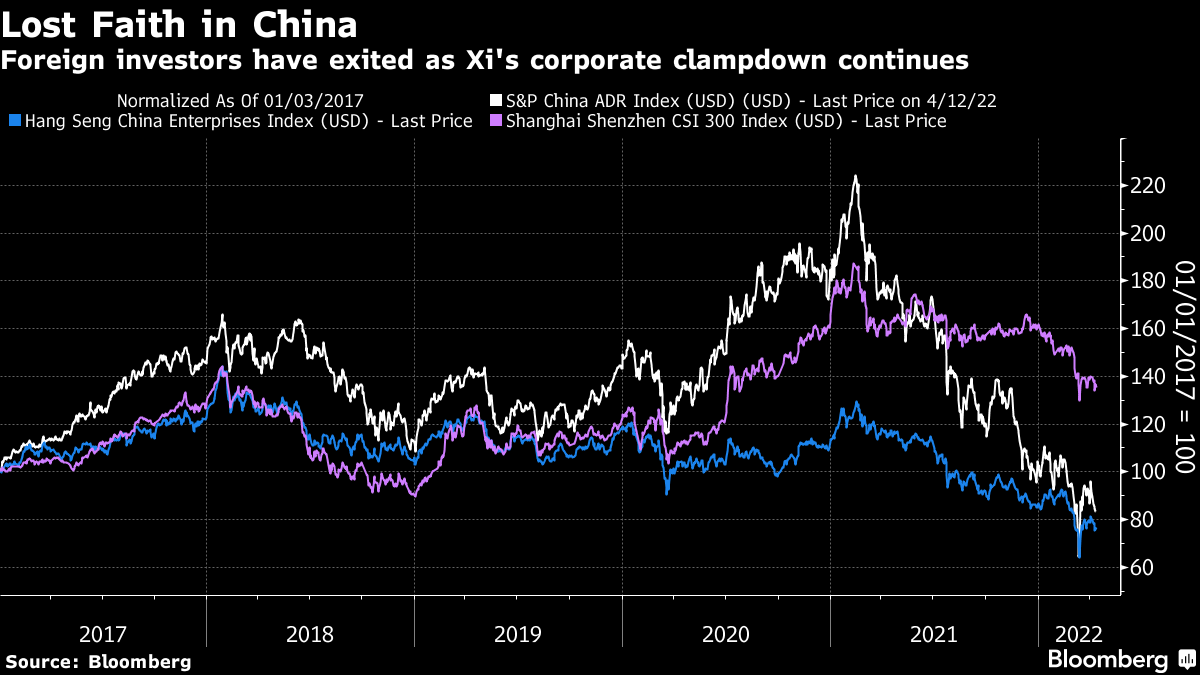
The crackdown on the corporate sector by the Chinese administration has combined with increasing aggressiveness by U.S. authorities on listings to drive a collapse in foreign investors’ confidence. The fall for American Depositary Receipts has been particularly steep:
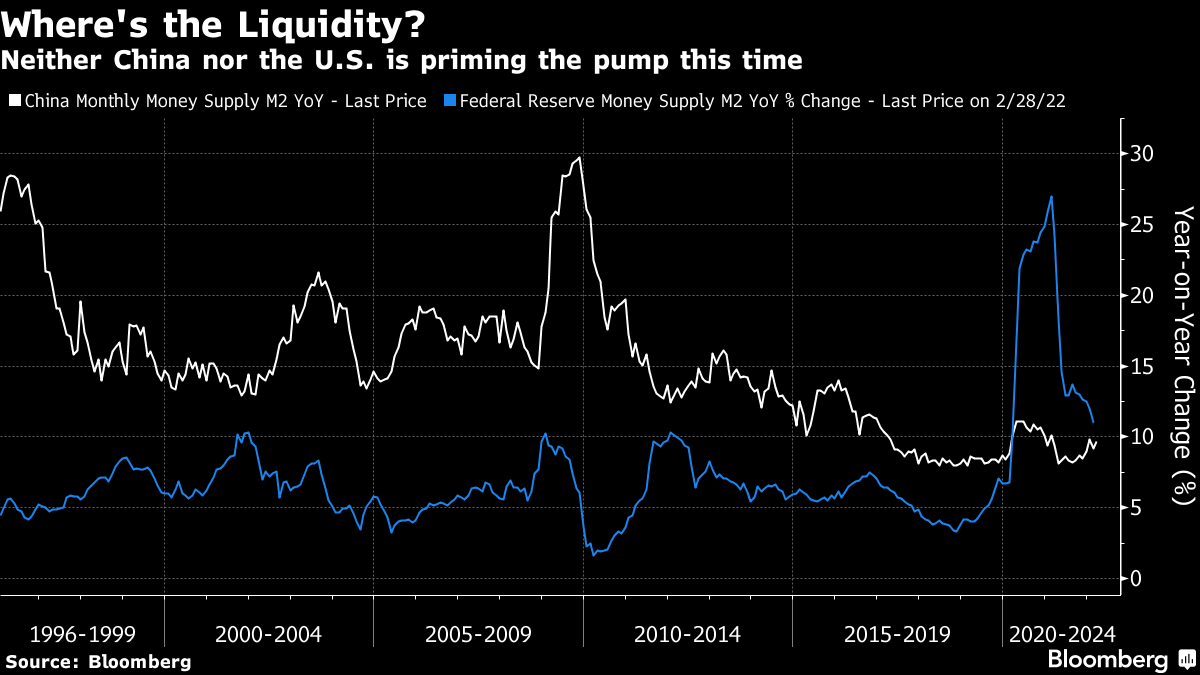
Then there’s the issue of monetary policy. If we use growth in M2 money supply as a simple measure, it becomes apparent that monetary supply in China has grown more slowly than in the U.S. since the pandemic. This is a complete reversal of the aftermath of the Global Financial Crisis, when China made a massive credit expansion, helped bail out the rest of the world in the process, and sowed the seeds for its recurring problems with credit ever since. Beijing announced that it would be market-friendly last month, as the selloff of Chinese stocks became acute; it’s still not clear whether that will mean the significant expansion in credit that has helped emerging markets in the past:
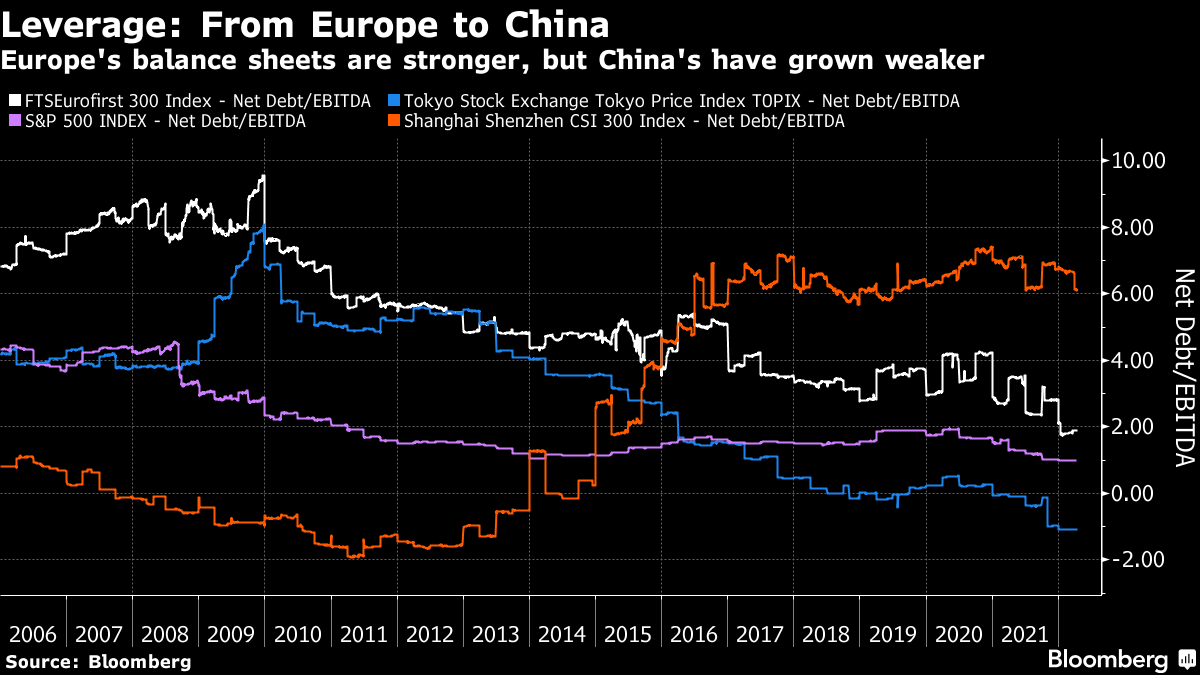
Liquidity isn’t just an issue for the central bank. Returning to the ratio of Ebitda to net debt, we can see that the corporate world has been inverted since the GFC. Back then, Chinese companies had far stronger balance sheets than their counterparts in the West and particularly in Europe. After all, they had constantly growing revenues to provide them with funds. In the years since, however, Chinese balance sheets have steadily weakened as those of the western world have strengthened. Japanese stocks in the Topix index now have negative net debt, while the net debt of Chinese stocks quoted in Shanghai and Shenzhen is six times Ebitda:
China is the biggest country in emerging market indexes, and its influence is vast. But that influence is no longer quite so positive. Twenty years ago, China’s insatiable and growing appetite for materials pulled up the entire emerging market complex. Now that relationship no longer holds good, and China’s position has helped to ensure that emerging markets aren’t benefiting from this commodity boom.
- Why have stocks risen, and bond prices fallen, since the Russian invasion of Ukraine when at other times of war, investors have sheltered in bonds?
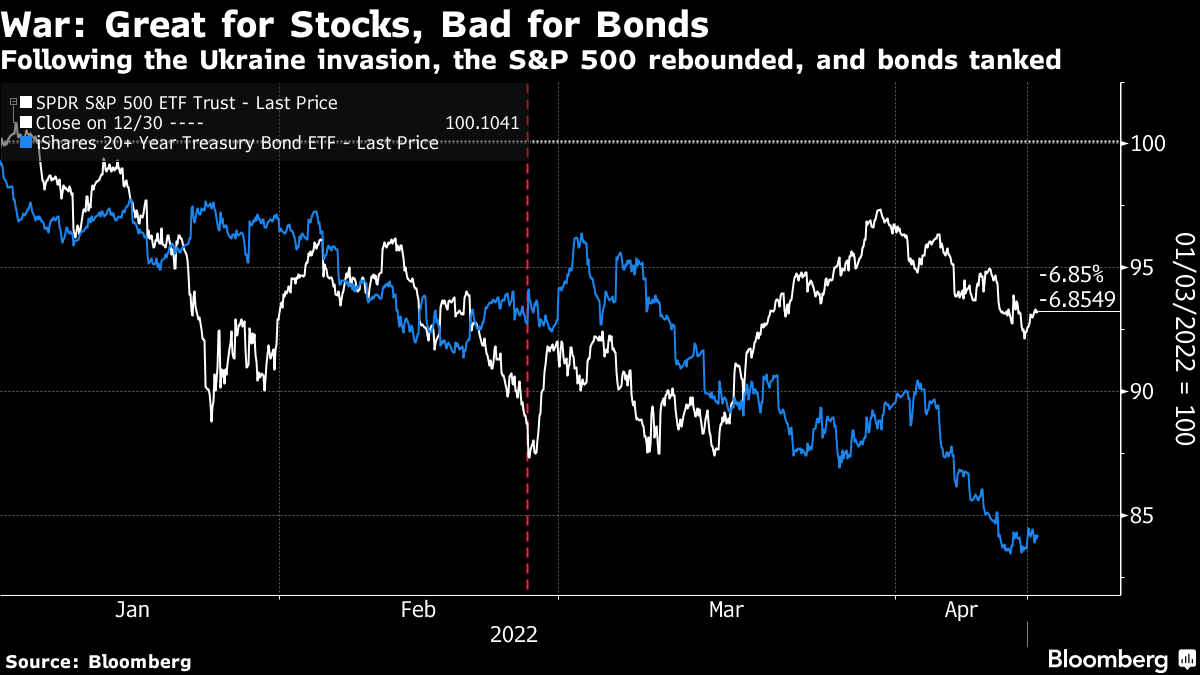
This makes little sense. Few people expected the invasion up to the minute when it happened, and little risk of it showed in prices. And yet after a very brief flinch, stocks have rebounded and bonds continued an increasingly vertiginous fall:
The bond side of the equation is easier to explain. Inflation continues to rise, and the Fed has sounded ever more hawkish, so of course bonds’ prices go down and their yields go up. What would have happened to the bond market without the huge new risk from Ukraine giving people a big new incentive to buy Treasury bonds as a shelter? That’s one of those counterfactuals that is unanswerable, but it’s possible that without Vladimir Putin’s misadventure, bond yields would have risen further and toppled stocks from their perch.Why stocks have risen is tougher to explain. Earnings expectations have moderated a bit since the invasion, and momentum has slowed. The resilient earnings forecasts for the full year certainly help to explain why stocks haven’t sold off more, but they still don’t give a good reason for such a rally.
There is a possibility that stocks are beginning to act as a haven, even though they appear very overpriced. The big tech platforms in particular seem to be regarded almost as an alternative to Treasury bonds. The NYSE Fang+ index companies have very strong balance sheets, and well-protected earnings streams, so they have appeal.Then there’s the possibility that stocks look like great sources of return. The evidence of rising inflation and a hot U.S. economy makes it reasonable to hope that companies can raise prices to defend their profit margins, while selling more stuff. In that case, greed rather than fear gives a reason to buy stocks.
But it’s still very hard to escape the most obvious explanation for stocks’ rally since Russian tanks crossed the border. The situation is unambiguously grimmer now than it was then; damage has been severe; the war is dragging on; sanctions are already enough to mess up world trade, are likely to escalate, and look like they could continue indefinitely; and there is still a risk of an expansion of the conflict beyond Ukraine’s borders.
This is a perilous time for the world. The best explanation for stocks’ rally is that investors somehow don’t get that. Which is alarming.