Uddrag fra Deutsche Bank:
Markets often behave inconsistently, with patterns that don’t make obvious sense between asset classes.
This got Deutsche Bank’s Henry Allen thinking about what some of the most obvious dislocations are today, considering what looks odd, and therefore what might be ripe for a correction.
Several sprung to the macro strategist’s mind.
In particular, markets are pricing in Fed rate cuts, even as they expect inflation to linger above target. Meanwhile in the UK, there’s been an interesting divergence between sterling and gilts, which have underperformed, whilst sterling IG spreads are around their tightest levels since the GFC. Otherwise, it’s clear that markets aren’t fully accounting for Trump’s tariff threats, whilst US equity valuations have never been this high with growth this comparatively weak.
So what are some of the biggest market dislocations right now?
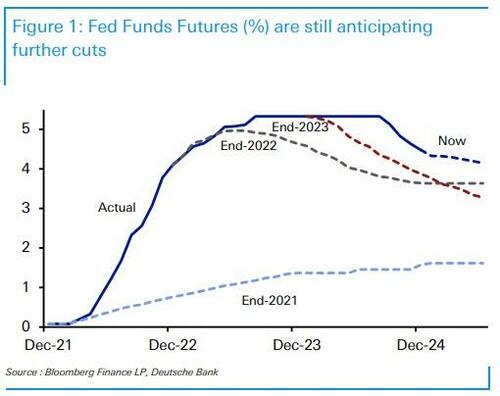
1. Markets are pricing in Fed rate cuts this year, even though they’re also pricing inflation that lingers above the Fed’s target.
If we look at Fed funds futures, currently 43bps of rate cuts are priced in by the Fed’s December meeting. On one level that makes sense, as their latest dot plot signalled 50bps of cuts this year, and speakers have continued to suggest the path remains lower.
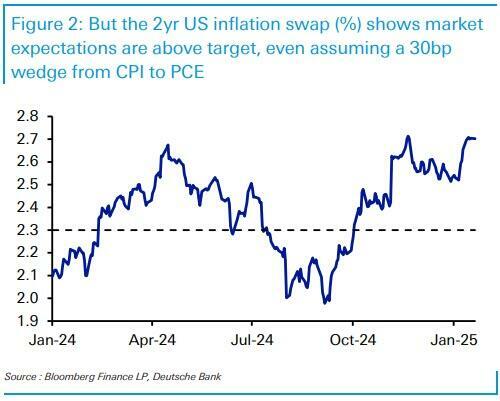
But at the same time, investors are also pricing that inflation is set to linger above the Fed’s target. For instance, the 1yr inflation swap is currently at 2.77%, the 2yr inflation swap is at 2.70%, and even the 5yr inflation swap is at 2.58%. Now it’s true that the swaps are priced using the CPI measure, and the Fed’s target of PCE tends to be a bit lower. But even if you assume a 20-40bp wedge between the two, that still implies PCE will average around 2.3-2.5% over the next two years.
Given the recent record of above-target inflation since 2021, it seems hard to imagine that the Fed would want to take risks in easing too aggressively. And we also know that inflation has sped up in recent months, with the 3- month annualised rate of CPI at 3.9% in December, the fastest in 8 months.
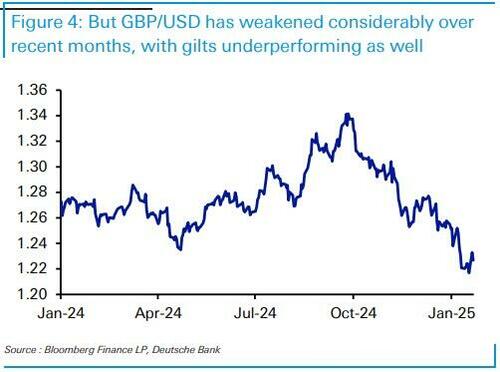
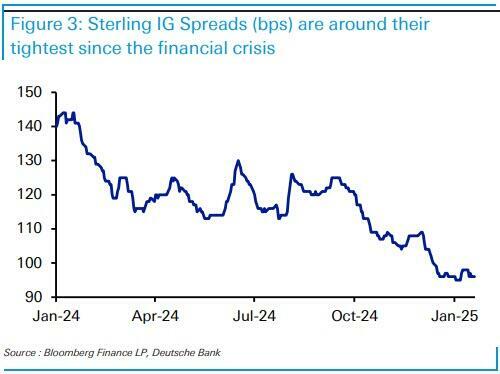
2. UK markets have seen a strange divergence across different asset classes: gilts and the pound sterling have underperformed in recent months, yet sterling IG spreads are around their tightest since the global financial crisis.
UK assets have mostly underperformed over the last couple of months. Since the start of December, the pound sterling is down -3.9% against the US Dollar, and -1.3% against the euro. In addition, gilts are down -2.9% in total return terms, larger than the -2.1% decline in Euro sovereigns or the -1.8% decline in US Treasuries.
But credit has been the exception. In fact, sterling IG spreads have tightened by -12bps in that time to 96bps, around their tightest since the global financial crisis. Moreover, if anything that’s an outperformance relative to others, with US IG spreads tightening -2bps in that time, whilst Euro IG spreads have tightened -11bps. Moreover, Euro IG spreads are still clearly above their lows in mid-2021.
This divergence appears strange, but it lines up with the view from our credit strategists in their 2025 forecasts, which see sterling IG spreads widening over the coming months, and by more than Euro IG spreads over the rest of the year.
3. Markets don’t believe that President Trump is going to be as aggressive on tariffs as he’s pledged, even though he’s pushed back against reports of going softer and the first term demonstrated how the more aggressive trade policies weren’t implemented until the second or third year.
It’s clear that investors are sceptical that President Trump will follow through on his tariff pledges.
- First, in the global markets survey run by DB in December, more than 80% thought Trump would be less aggressive than his campaign pledges.
- Second, markets saw a big reaction to a Washington Post report in early January, suggesting that Trump’s aides were looking at a universal tariff that only covered critical imports. However, Trump himself responded swiftly, saying that the story “incorrectly states that my tariff policy will be pared back. That is wrong.”
- On inauguration day itself, there was then another rally after the WSJ reported that Trump wouldn’t impose new tariffs on his first day in office. This is despite the fact in his first term, tariffs didn’t start to be imposed until 2018, the second year of his presidency.
Clearly there’s a huge debate around “what is priced”, but our rates strategists found that before the inauguration, CPI pricing was consistent with a 5% universal/20% China tariff. Yet Trump himself openly discussed the idea of 60% tariffs on China in the campaign, and the tariffs escalated over time in his first term.
Looking forward, April 1 will be a key date, as several reports will be coming back to Trump that day, as per his memorandum on “America First Trade Policy”.
In summary, markets are pretty exposed, even if Trump only follows through on his stated tariff threats.
Indeed, his day one discussion of 25% tariffs on Canada and Mexico has seen the Canadian dollar weaken another -1% this morning as we go to press. That in turn would again have implications for US inflation, and our US economists wrote in late November that if you assume that 25% tariffs on Canada and Mexico see a passthrough of 75%, it could increase the 2025 core PCE inflation by a full percentage point.
This is clearly something markets aren’t accounting for right now.
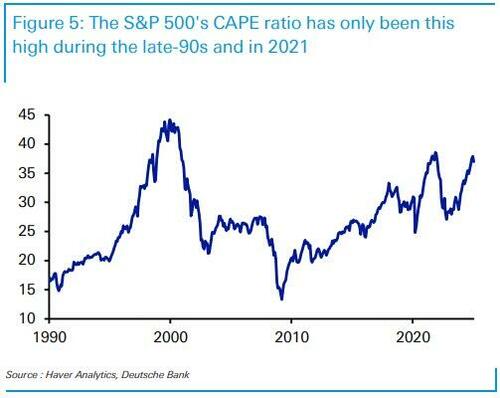
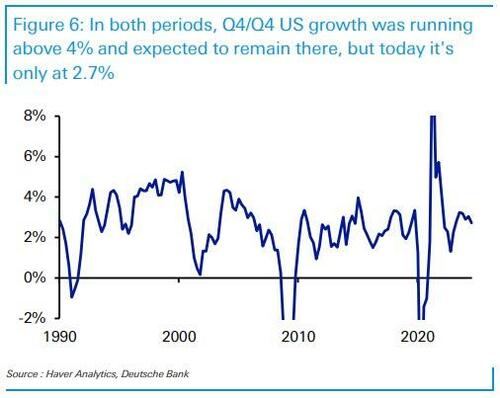
4. US equity valuations have never been this high with growth this weak. The last time we saw the CAPE ratio this high (in the late-90s and 2021), US growth was running at an annualised pace above 4%.
A lot of questions have been asked about the relentless US equity rally, with the S&P 500 having posted back-to-back annual returns above 20% for the first time since the dot com bubble in the late-1990s.
But a key difference is that growth was much stronger in that period, with growth above 4% per year from 1997-2000. At the time, that was expected to continue, and the Fed’s staff forecasts in January 2000 expected growth for 2001 at +3.9%, even if the reality was a much more subdued +1.0%, which coincided with the bubble bursting.
Similarly in late-2021, growth was very rapid during the post-Covid rebound. It’s true that was always expected to slow, but the speed of the decline was surprising to most forecasters. Indeed in December 2021, the Fed’s SEP still looked for +4.0% growth in 2022 (Q4/Q4), yet the reality was a +1.3% rate, with recession fears mounting.
So in both those instances, growth was running above 4% and expected to remain in that zone for at least the subsequent year. But today, growth is only at +2.7% over the last four quarters, and expected to continue in the low/mid 2s.
That means that US equity valuations are the highest they’ve been with such a subdued rate of growth.
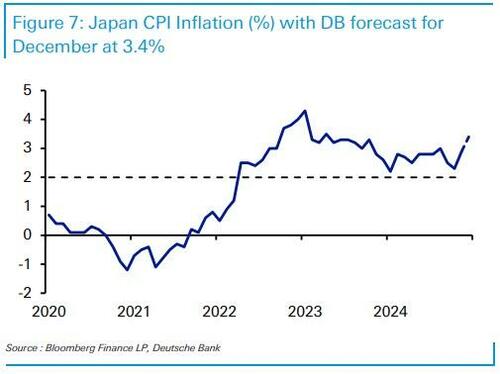
5. In Japan, inflation has been above target since April 2022, and the consensus expects a further rise in this week’s CPI release, up to +3.4%. The Bank of Japan are also in a hiking cycle, yet the country’s 5yr yield is only at 0.84%.
In the US and Europe, yields moved up aggressively over 2021-23, as it became clear that inflation was structurally higher and that policy rates would not be heading back to the zero lower bound. It feels obvious in retrospect, but the idea of a Fed tightening cycle of 525bps would have seemed absurd to many in early 2022.
Given that inflation is still lingering above target in Japan, alongside stronger wage growth, it feels like markets are neglecting the risk of a more durable regime shift.
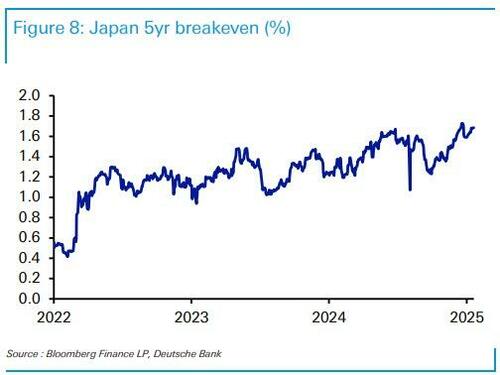
Indeed, the 5yr Japanese breakeven is still only at 1.68%, so it’s clear that investors are still expecting inflation to fall back below target again.
And so far, as with the US and Europe, we can see from the breakeven that there’s been a slow and ongoing realisation that the country is entering a new normal of higher inflation.
With hindsight, this clear gap between inflation and the policy rate came before aggressive hiking cycles from both the Fed and the ECB.


