

Nordea analyserer den aktuelle diskussion blandt obligationshandelere og økonomer: Får vi deflation eller hyperinflation i USA? Nordea mener, at vi bør frygter deflationen. Den er mere reel på grund af det lave forbrug, de lave oliepriser og gældsætningen. Men kan den ende i hyperinflation? Risikoen er der, mener Nordea, hvis den amerikanske regering og centralbanken bruger “helikopter-penge” som eneste mulighed for at sætte skub i økonomien.
Uddrag fra Nordea:
US: Deflation vs. hyperinflation risks
The perhaps hottest topic among bond traders and economists is whether we will see deflation or hyperinflation in the coming quarters. We chip in on the discussion, arguing why you should fear the former the most.
Arguably the most heated debate among economists at the moment is whether the combination of the COVID-19 economic shock and the following unprecedented monetary and fiscal responses will lead to deflation or hyperinflation. The discussions are wide in range.
You may hear arguments based on anecdotical evidence such as “retail stores are lowering prices so they can attract customers” or “prices on housing equipment are rising because people are in lock-down and now have time to work on their houses”. While all these micro observations are interesting and good story-telling, they do not tell us much about the overall inflation picture. Here we need to look at the macroeconomics.
Our conclusion has obviously already been revealed with the subheading: We think deflation risks are most imminent. While it could therefore be tempting to just show/give you 100 charts and reasons why we are entering a deflationary environment (btw look at section three), the picture is not that black or white.
Instead, let us kick off by making some inflationary points, before we present our “no hyperinflation” and deflationary arguments in the last two sections, respectively (in a bullet format so this does not turn into a novel).
1) Inflationary arguments
i) COVID-19 was initially a supply shock. This is still “dominating” negative demand shocks in some sectors which should lead to higher prices. This phenomenon is especially linked to critical goods and services (such as freight)
ii) Public and private debt are on the rise. The all else equal textbook answer to this is higher inflation
iii) COVID-19 could lead to less globalisation and more populism. Structurally, this is an inflationary driver
iv) If productivity slows due to, for instance, loss of knowhow, profit margins get squeezed which firms may offset by hiking prices (ignoring here the counteracting factor of less productivity leading to slower growth and hence less demand-pull inflation)
v) Besides the obvious inflationary argument of US fiscal compensation packages being directed straight at people’s wallets, weekly unemployment benefits are above the median of the lower percentile of income earners. Theoretically, relative higher benefits should lead to low income workers demanding higher wages when/if they are re-hired (the unique corona situation may, however, change that normal behaviour)
vi) Finally and most important to many hyperinflationistas, Fed’s open-ended QE has resulted in its balance sheet exploding and it appears we are not close to the end (Fed Watch: Forecasting balance sheet bananas and yield curve control). Increasing the monetary base is inflationary – in particular for asset prices
Chart 1. QE has boosted asset inflation

2) Why hyperinflation is not re-born
The above outlines that there are indeed many inflationary forces at play. The deflation factors are, however, just more pronounced, in our view.
When making the case for deflation risks, perhaps the best starting point is by killing the hyperinflation argument. In order to do so, we need to take a little theoretical detour and address our last inflationary point about the Fed’s QE and so-called money printing machine. For starters, if you hear someone saying that “the Fed is printing money”, it is either because they are stuck in their pre-2008 textbooks or because the phrase has become so common that they have turned lazy and use it anyway. Admittedly, we sometimes find ourselves dozing off into the latter category.
Thus, when the Fed does QE, asset purchases are conducted via crediting newly made bank reserves. However, this only increases the monetary base, not directly the money supply. The latter is where money/cash are really created (or “printed”) and what matters most for inflation (although an increasing monetary base has indeed proven to be the most important factor for asset inflation: From QE to QT to “new normal”).
In order for the money supply to increase banks have to lend to consumers and businesses (for a deeper explanation, see BoE’s famous 2014 paper on money creation). The extent to which banks lends out and thereby creates cash is implied by the money multiplier. This has fallen off a cliff after the GFC (see chart 2). In contrast to what is commonly understood, the money multiplier is not directly controlled by the Fed, but by banks’ lending incentive, domestic demand, regulation, etc.
Chart 2. Can you spot when QE was born and led to a decoupling between the money supply and the monetary base?
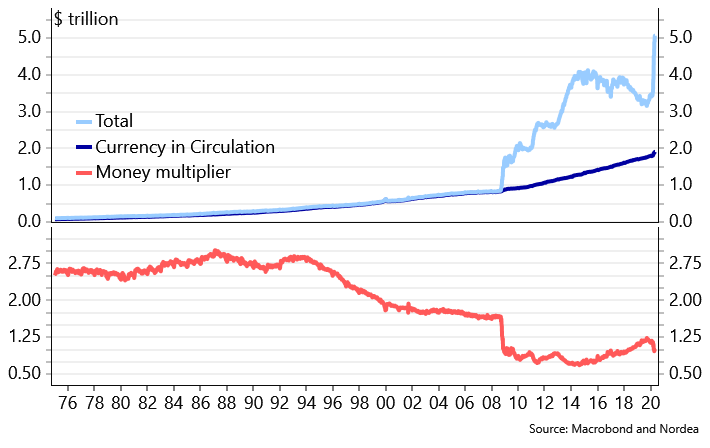
Looking at the period post-GFC, it is in fact the monetary base that has skyrocketed – not the money supply, as the money multiplier has declined. This is an important explanation why inflation has been stubbornly low.
Then fast-forwarding to today, the hyperinflationistas may now (correctly) counterargue that the money supply has in fact spiked in recent weeks (chart 3).
Chart 3 & 4. The money supply has spiked recently….
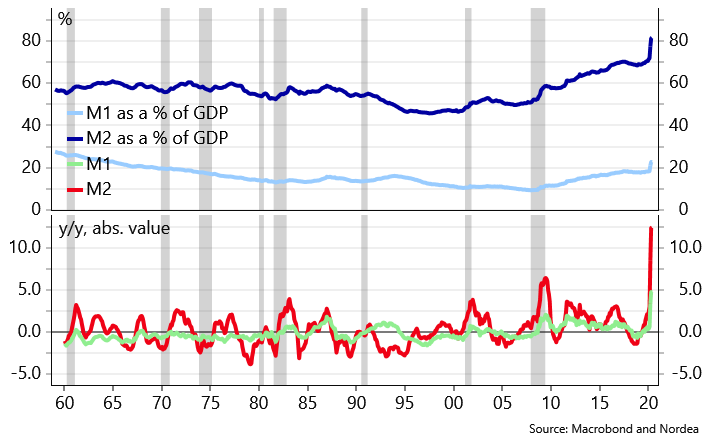
However, we would argue that i) a spike in the money supply is not unusual during deflationary recessions, and ii) the higher money supply is offset by a collapse in money velocity. The latter reason is the key to why you should not expect hyperinflation.
In our view, there is thus no way hyperinflation will materialise unless money velocity at least stabilises, which is unrealistic in the current environment where demand is collapsing.
…but at the same time, money velocity has collapsed
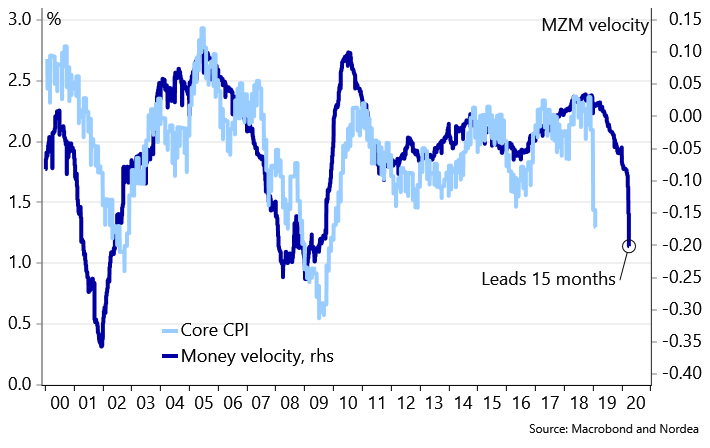
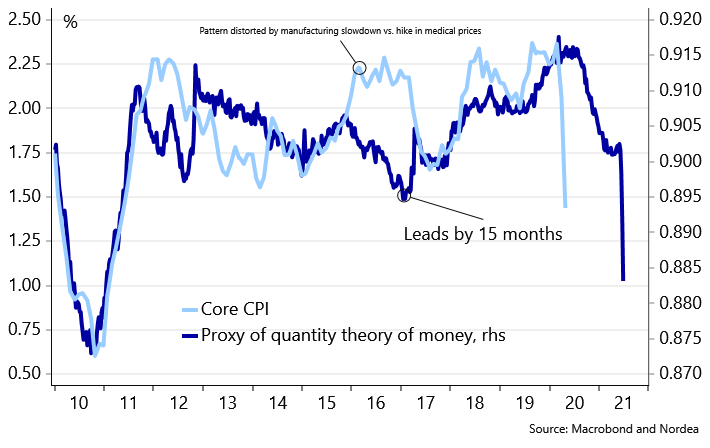
If you don’t believe in the above argument, then you don’t believe in the quantity theory of money (which some economist admittedly don’t). The below chart shows our proxy model for the quantity theory of money which indicates prices should move lower.
Chart 5. Our CPI model based on the quantity theory of money
3) Deflationary factors
If we now take off our monetarist hat (and we haven’t bored you to death with all of this theoretical rambling), we will give some more simple deflationary reasons.
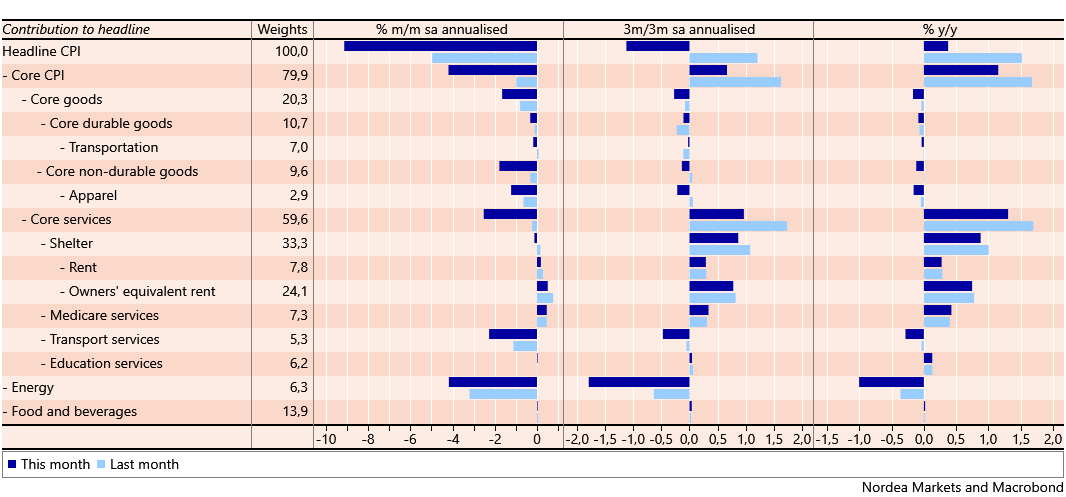
i) First, oil prices have declined. Besides having a negative effect on long-term inflation expectations, the immediate drag on headline CPI will be significant. The energy component weights 6.3% in the US CPI basket, so with a 17.4% decline y/y – like in April – this translates into a 1.0%-point subtraction to the headline index.
Chart 6. Falling energy prices are a significant drag on headline inflation
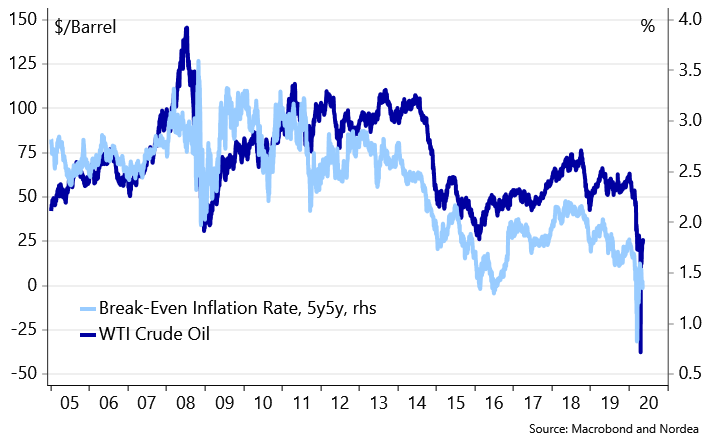
ii) Unanchored inflation expectations do tend to drag on spot inflation. Although long-term inflation expectations have recovered somewhat after the collapse in mid-March, a level around 1.75% still effectively means that you in the long-run will undershoot your target by 0.25% on average. And btw, medium-term tenors (such as 2-year breakevens) are trading in negative territory.
Chart 7. Long-term inflation expectations need to be re-anchored
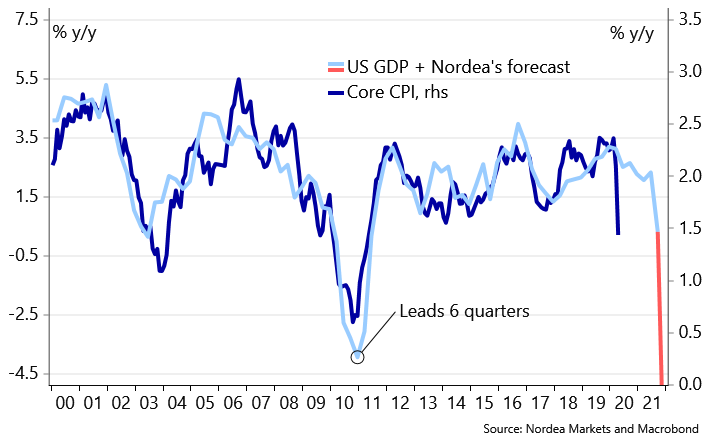
iii) We argued back in February that the immediate supply shock would turn into a demand shock. A view, we have not changed since (and has now turned into consensus). If we are right, this should lead to a plain simple negative demand-pull on prices (and remember that demand shocks usually result in more “sticky” prices than supply shocks). So far, our view is at least in line with reports from local Fed districts.
Chart 8. Prices will most likely decline due to the significant negative demand pull from no economic activity
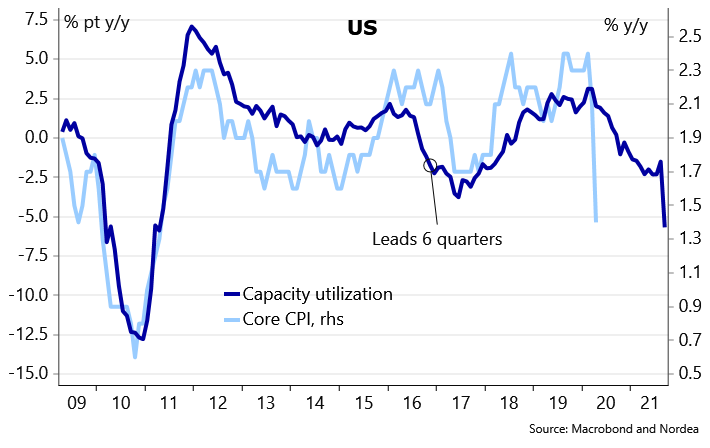
iv) The meltdown in activity has in turn led to a big negative output gab and a bleeding labour market (US Macro: The worst nonfarm payroll number in history). This creates downward pressure on capacity utilisation and hence prices.
Chart 9. Lower capacity utilisation means less price pressure
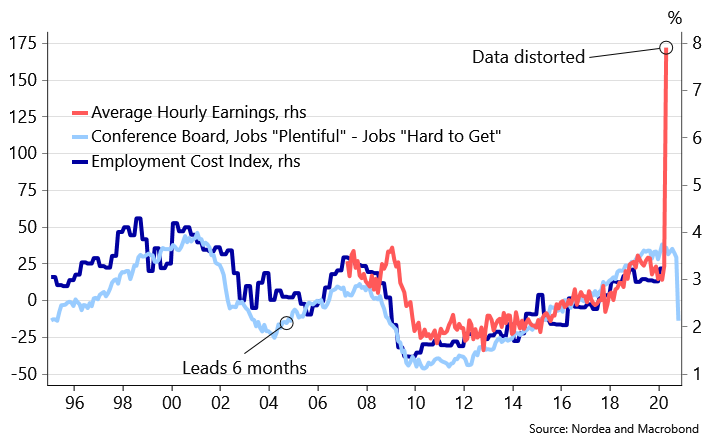
v) Looking at wage growth, you may think that this will be a big positive contributor to inflation, solely judging by the April job report where average hourly earnings completely exploded. However, this was simply due to low income earners being withdrawn from the equation, ie a technicality, which does not show the underlying picture.
Chart 10. Wages in the April nonfarm payroll skyrocketed, but it does not give the correct underlying picture
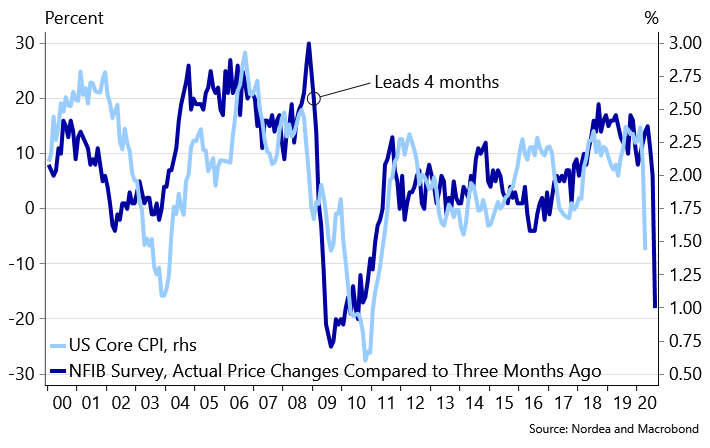
vi) A more accurate picture is instead given in, for example, the Fed’s April Beige Book or the NFIB small businesses survey. In the former survey, no district reported upward wage pressure. Instead, most agents cited expectations of wage softening and salary cuts. The same picture was evident in the NFIB survey (see chart 11).
Chart 11. Small businesses are reporting decreasing prices
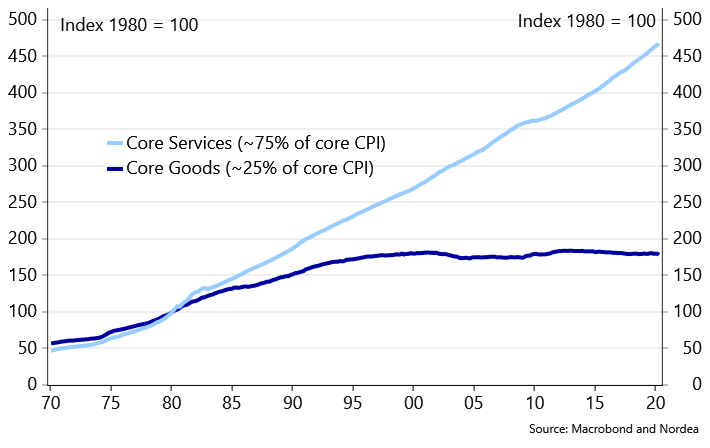
vii) Moreover, wages are normally linked to the service sector which has by far been the hardest hit. Services, which constitutes around 75% of the CPI basket, may therefore “overtake goods’ role” as the disinflationary force in the coming quarters.
Chart 12. Service inflation has been the driver of total inflation for years. Will that change in the coming quarter?
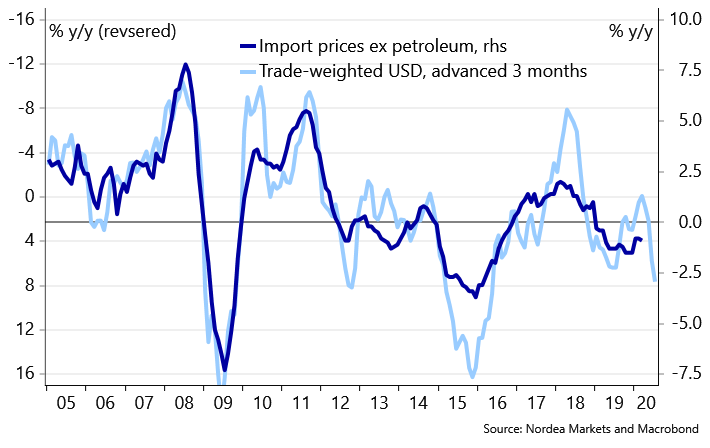
viii) Another factor is the dollar which has appreciated during the COVID-19 outbreak due to safe haven flows. The FX pass-through here is disinflationary on import prices.
Chart 13. The stronger dollar puts downward pressure on import prices
ix) Finally, we believe there will be some structural disinflationary trends. Among many, these involve slower population growth, unproductive debt increases (possible combined with fiscal austerity) and more digitalisation.
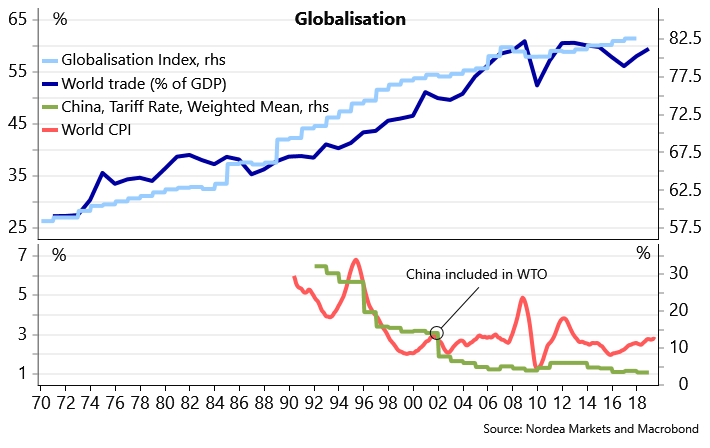
Chart 14. More globalisation over the past decades has been a disinflationary force
Conclusions….
The bottom line is that we see deflation risks as a much bigger concern for the Fed than hyperinflation. The vast majority of our leading indicators point at a significant downward price pressure in the next few quarters – a pressure, which monetary policy may not be able to alleviate in the short-run. As Friedman famously said: Monetary policy works with “long and variable lags”.
The Fed’s job is therefore instead to make sure that long-term inflation expectations gets fully re-anchored. If not, deflation risks may turn sticky and more permanent. Whereas the last decade was one of too low inflation, the 2020s may thus – in a worst case scenario – end up being the decade of no inflation.
….and some final food for thought for the hyperinflationistas
Let us conclude by offering some final food for thought and turn the hyperinflation question upside down: What would it then take for hyperinflation to materialise? In our view, the biggest risk is perhaps a bit overlooked one, namely if the Fed broke the taboo of conducting real money printing. Ie not using current pseudo deficit debt monetization, but financing deficits by crediting the Treasury account at the Fed. This would be true “Friedman helicopter money”.
While it may seem a bit far-fetched, we will simply state that these are indeed unusual times and we remember that even Bernanke played with the idea as late as in 2016. But do the politicians dare pull the real helicopter money trigger (and should they)?