Uddrag af bogen The Next Economic Disaster: Why It’s Coming and How to Avoid It. — fra Naked Capitalism.
By Richard Vague, currently the managing partner of Gabriel Investments and the chairman of The Governor’s Woods Foundation, a non-profit philanthropic organization. Previously, he was co-founder and CEO of an an energy company and two consumer banks
In the aftermath of the 2008 financial crisis, most of the economic debate has focused on the subject of government debt—on “austerity vs. stimulus.” One side blames government debt for impeding economic growth and thus prescribes a reduction in government spending called “austerity,” while the other side calls for more government deficit spending as the necessary “stimulus” for strong economic growth.
Both sides miss a much more central point.
The primary issue is not public debt but private debt. It was the runaway growth of private debt—the total of business and household debt—coupled with a high overall level of private debt that led to the crisis of 2008. And even today, after modest deleveraging, the level of private debt remains high and impedes stronger economic growth.
Rapid private debt growth also fueled what were viewed as triumphs in their day—the Roaring Twenties, the Japanese “economic miracle” of the ’80s, and the Asian boom of the ’90s—but each of these were debt-fueled binges that brought these economies to the brink of economic ruin.
Those crises are the best known, but almost all crises in major countries have been caused by rapid private debt growth coupled with high overall levels of private debt. The reverse is true as well; almost all instances of rapid debt growth coupled with high over- all levels of private debt have led to crises.
There are two claims you can count on: Booms come from rapid loan growth. And crises come from booms.
Alan Greenspan, who was chairman of the Federal Reserve until 2006 and who presided over much of the runaway increase in mortgage loans that was central to the 2008 crisis, wrote recently in reference to this crisis that “financial bubbles occur from time to time, and usually with little or no forewarning.”
Alan Greenspan is wrong.
It was neither a “black swan event” nor a crisis in confidence. There was plenty of forewarning—in fact years’ worth. This crisis was predictable, and major financial crises of this type can be seen—and prevented—well in advance.
Beyond the issue of rapid short-term loan growth, the United States has been on a long-term and continual path of increasing private debt to GDP. It is astonishing what’s happened: over the past seventy years, the level of private debt to income and GDP—in the United States and across the entire globe—has climbed steeply higher. In the United States, it has almost tripled from 55 percent in 1950 to 156 percent today. What is equally astonishing is how little attention it has received.
While runaway loan growth was the cause of the crisis, loan growth at a more moderate level is a favorable driver of economic growth. This seeming paradox is one of the subjects of this book.
(Note: I use the terms economic growth and GDP growth interchangeably in this book—GDP growth is simply the sum of private, business, and government spending plus net exports. And income closely mirrors GDP, so whenever I mention GDP growth, it encompasses income growth too.)
When debt growth is too rapid, it brings economic calamity, especially if coupled with private debt levels that are already too high, since high private debt levels make businesses and consumers more vulnerable to economic distress.
For large economies, private loan to a GDP growth of roughly 18 percent or more in five years is the level at which that growth becomes excessive. (I discuss the few exceptions in the book.) On top of this, apart from any crisis, the accumulation of higher levels of private debt over decades impedes stronger growth. Money that would otherwise be spent on things such as business investment, cars, homes, and vacations is increasingly diverted to making payments on that rising level of debt— especially among middle- and lower-income groups that compose most of our population and whose spending is necessary to drive economic growth. Debt, once accumulated, constrains demand. And debt growth here and abroad over any sustained period always exceeds the income and economic growth it helps create, a troubling phenomenon intrinsic to the system.
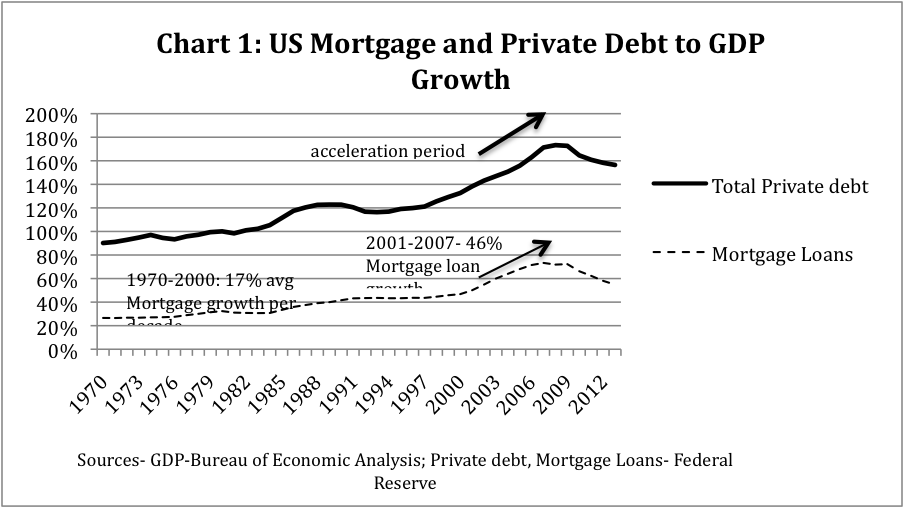
Runaway growth in private debt (especially high mortgage loan growth)—and not growth in government debt, a lack of consumer or business confidence, or myriad other explanations—was the immediate cause of the 2008 crisis. US mortgage debt grew from $5.3 trillion in 2001 to $10.6 trillion in 2007, an astonishing doubling in six years. This contributed to high absolute levels of private debt to GDP, a level that reached 173 percent in 2008. In larger, more developed economies, when high growth in private debt is coupled with high absolute levels of private debt, it has almost always led to calamity. Since this buildup of excessive private debt occurred over several years, it should have made the prediction of the crisis and its prevention both possible and straightforward.
But it wasn’t just mortgage loans. Business debt to GDP picked up markedly starting in 2006, and overall private debt increased at a pace rarely seen during the last century in the United States—an increase of 20 percent to GDP in the five years leading up to the crisis. (See Chart 1.)
By contrast, in 2007, the federal government debt to GDP was slightly lower than it had been ten years before and didn’t accelerate until after the crisis. Benign growth in government debt is typical of the period preceding most significant financial crises.
As Chart 2 shows, from the sheer dollar amounts involved, it should be no surprise that private debt would be a primary driver of the economy. This chart shows the increase in key categories from 1997 to 2007—the decade preceding the crisis:
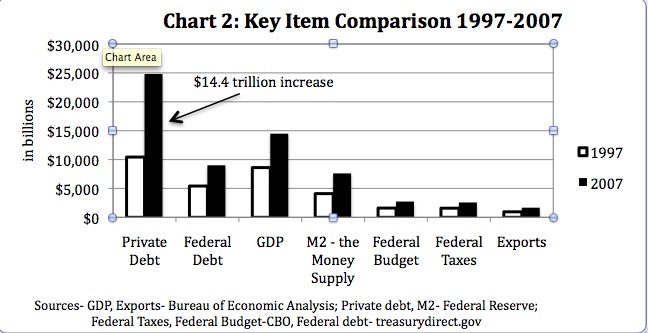
From 1997 to 2007, lenders flooded the US economy with $14.4 trillion in net new private loans. Federal debt increased by a significantly smaller amount—$3.6 trillion—during that same period. An increase in bank loans represents the entry of additional money into the economy. For all the talk of the US government and the Federal Reserve Bank “printing money,” it is private lending that creates the most new money entering the economy. The primary constraint on that new money flooding the economy is the capital requirements imposed on those lenders. Anyone who has been granted a loan and had the proceeds of that loan deposited into his or her account has just witnessed the deposit of newly created money into the system. The idea that savings and deposit growth must precede loan growth and thus leads to loan growth is misguided. Instead, loans create money and are thus a part of what creates deposits.
For this reason, total loans are a more accurate gauge of the amount of money in an economy than the “money supply” (the sum of deposits and currency), which is in large part a by-product of that lending.
The impact of private loans in this period far exceeds the impact of any other category. For example, a 10 percent reduction in taxes for each of these ten years would have brought no more than a $2.5 trillion increase in spending by the private sector, an amount dwarfed by the $14.4 trillion in new private sector spending enabled by this increase in private loans.
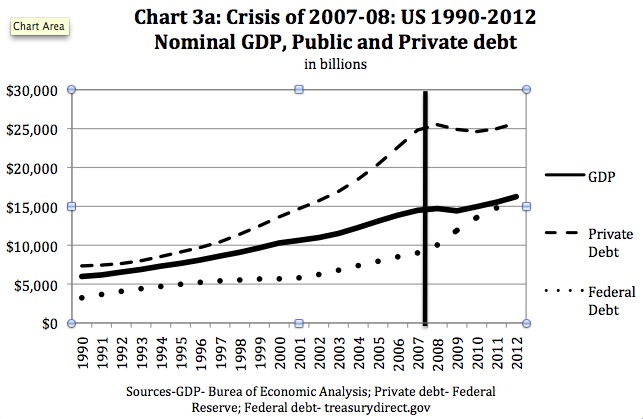
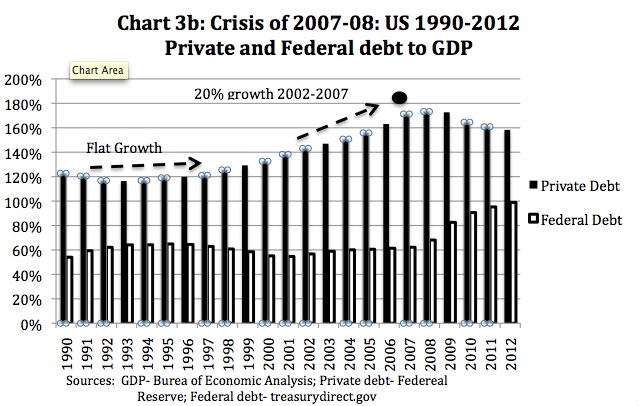
While US private debt to GDP growth is currently flat, as shown in Charts 3a and 3b (which I refer to as the “debt snapshot”), the crisis of 2008 came after the point where private loans to GDP had grown 20 percent in five years and total private loans to GDP exceeded 170 percent.
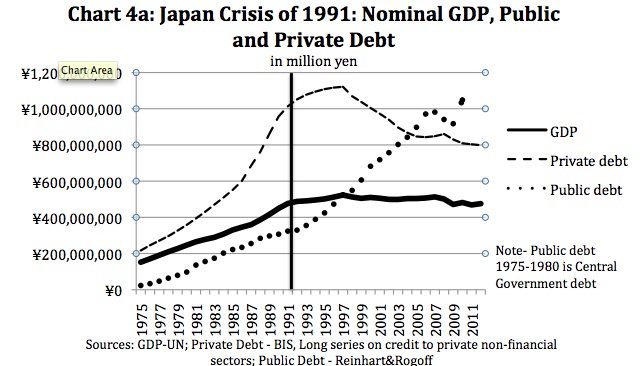
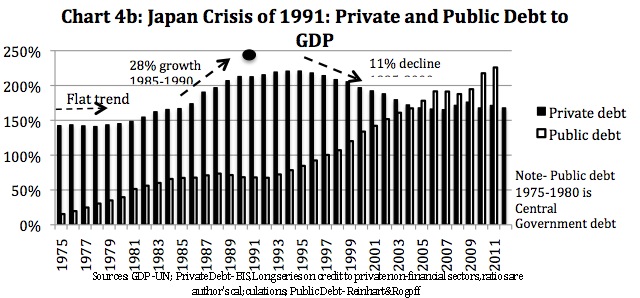
We looked at the two other largest crises of the last generation to see if private debt played a part there as well: Japan’s crisis of 1991, which followed its “economic miracle” of the 1980s; and the Asian crisis of 1997, which followed the “Asian economic miracle” of the 1990s. As shown in Charts 4a and 4b, in the period from 1985 to 1990, Japan’s private debt to GDP increased by 28 percent and reached 213 percent of GDP. And in the five-year run-up to the Asian crisis of 1997, private loans to GDP for South Korea and Indonesia grew 29 percent and 43 percent, respectively, and in South Korea, private debt to GDP reached 170 percent.
Runaway lending created the Japanese and Asian economic miracles, but those miracles brought crisis.
Government debt to GDP was relatively benign before the crash of 1929, the US crisis of 2008, and both the Asian crisis of 1997, and the Japan crisis of 1991. In the United States, even with its Middle Eastern wars and a major increase in social program expenditures, federal debt to GDP was no higher in 2007 than it had been a decade before. The five-year increases in government debt to GDP in Japan in 1991 and South Korea in 1997 were both near zero.
In fact, the government debt to GDP ratio sometimes improves in the “runaway lending” period and becomes something of a contraindicator. In Spain, before its recent crisis, government debt to GDP declined by 16 percentage points. The credit boom brings increased income to businesses and consumers, and one result is more tax revenues for the government. Most businesses and consumers feel good, even euphoric, about their financial situation during this runaway lending period. And governments start believing they have found the recipe for economic success, such that the talk is often of economic miracles. But it shouldn’t be, because the other economic shoe is now dangling and threatening to drop.
The ideal economic situation for growth in a given country and the world is to have less capacity (or supply) than demand coupled with low private debt. Instead, we have nearly the opposite situation in our time. In the first decade of the 2000s, the United States and Europe built far too much capacity, especially in housing, and incurred too much private debt. In the 1980s, Japan built far too much capacity, saddling its banks with too much private debt and too many bad loans. While all have been catching up to this capacity, none yet has less capacity than demand, and all still have high private debt. And now China, whose industrialization and urbanization long fueled global growth, has created its own overcapacity and private debt problem, building far too much capacity in many industrial and real estate projects with easy credit that fueled the most rapid buildup of private debt yet. So now the majority of the globe is in this less than desirable place. No major global economic player now has that pivotal combination of undercapacity and low private debt to fuel productive investment and help boost global growth.
Much has been written of late regarding the decline of the middle class. It is important to note that the size of the middle class grows in major countries (or the world) when there is too little capacity and low private debt (like after World War II). That is because a middle class is needed to build new capacity. Corporate debt can be used to fund the building of new capacity, while consumer debt can be used to fund the consumption of that capacity. In contrast, the size of the middle class plateaus or shrinks when there is too much capacity and too much debt (like there is at the present). Stated differently, inequality increases when there is high capacity and high debt; it decreases when capacity and debt are low.