

Fra Zerogehde/socgen:
Over the weekend, we showed that as of this moment, the S&P500 is more overvalued on a quantifiable EV/EBITDA and Price/Earnings basis than it was at the peak of the dot com bubble, making the market’s current valuation that highest ever recorded.
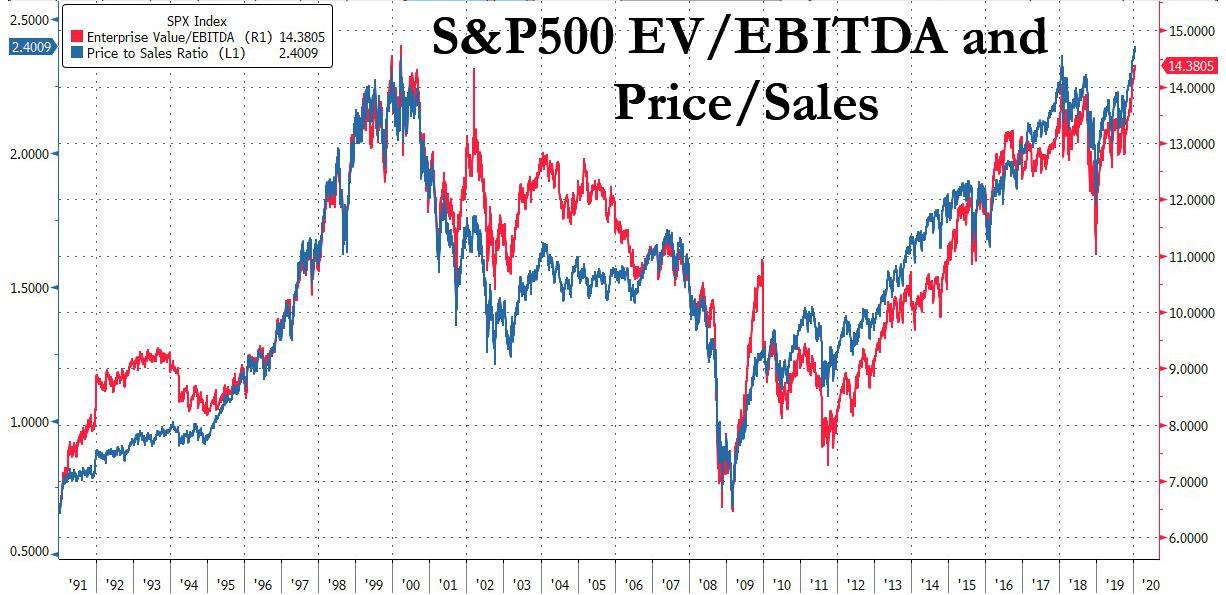
How to make sense of the above chart?
As Albert Edwards writes in his latest note, “stocks have rallied on the back of “not-QE4″ as the surge in the Feds balance sheet due to its repo-operations. But irrespective of whether the equity markets surge is due to Fed liquidity or not, the equity market is in effect discounting a surge in the real economic data and in corporate profits (chart below).”
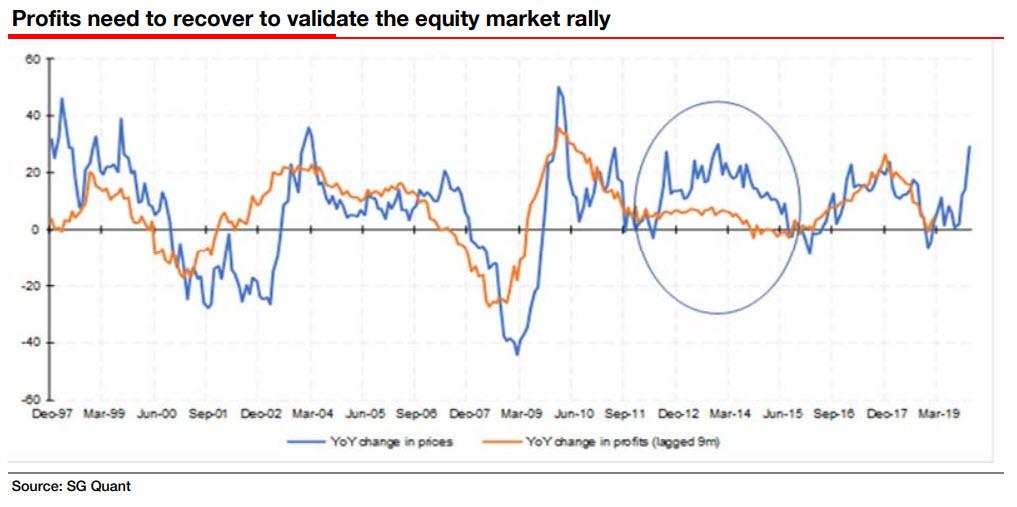
Or maybe, Edwards asks, just as in the circled part of the chart above shows, “the Fed’s balance sheet expansion can sustain equity market gains well in excess of any potential profits rebound. But for certain, investors have bet that weak economic and profits data is a mid-cycle pause.”
If that is indeed the case, then it is a direct echo of what happened in the late-1990s when the Fed injected massive liquidity to mitigate Y2K concerns, “especially with the same bubble-like characteristics of the technology sector.” Furthermore, as the SocGen strategist notes, “until recently, one clear parallel with the late 1990s tech bubble was the surge in analysts long-term (LT) earnings expectations as measured by IBES.”
Here Edwards takes us on a quick trip down memory lane, reminding that “none other than Alan Greenspan justified the surge in the late-1990s equity markets PE by the rise in this very LT expectations series (see red line in left-hand chart below). Greenspan actually believed that all those analysts making these high and higher LT eps forecasts independently couldnt be wrong. He was mistaken.”
In fact, and as is the case right now, Edwards argues that analysts in the late 1990s were simply driving up LT eps forecasts to reverse engineer their discounted cash flow models so as to justify maintaining their Buy recommendations for Tech, Media and Telecom stocks already on ridiculously high PE multiples.
These are typical of the creative techniques used to justify excessive valuations during liquidly fuelled rallies. (Remember CEO Scott McNeely of Sun Microsystems famous what were you thinking comment). Then when the bubble burst, long-term eps expectations came clattering down along with the market ie no need to pretend any more, or as Edwards summarized “What utter madness!”

But if the 1990s were madness, what about now? The answer: we have hit yet another “never before seen” chart print to explain the current investor euphoria.
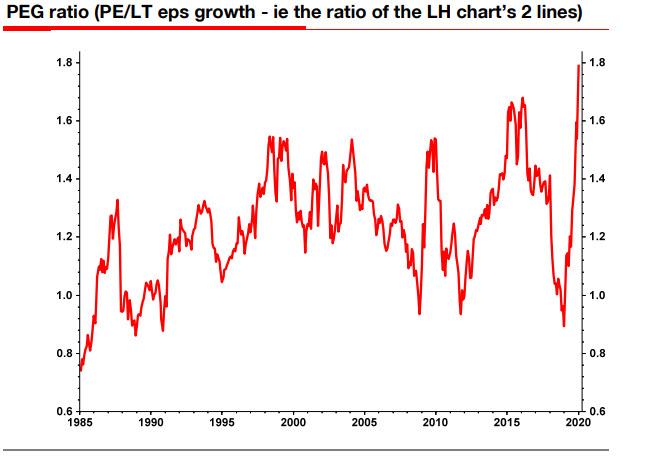
Consider the recent swing in analysts long-term eps forecasts, an echo of what happened just before the dot com bubble burst. Similar to then, increasingly high PE valuations (17x+) had taken the ratio of the 12m forward PE relative to analysts LT eps growth expectations (the PEG ratio) to a new record high of 1.7 at the start of 2016.
Analysts then raised their LT eps projections from the start of 2016 onwards, bringing the PEG ratio back down, until it collapsed below 1.0 when the market slumped 20% at the back end of 2018. And here the punchline: as Edwards shows in the remarkable chart below, since 2016, a slump in the LT eps series through 2019 has combined with a surge in the equity market to send the PEG ratio to a new record high of 1.8!
Edwards’ conclusion, as so often happens, is framed in the form of a rhetorical question:
Does the record PEG ratio and the continued fall in LT eps estimates mean that analysts have just given up justifying historically high PEs? Does it mean that analysts have given up reverse engineering their justifications for their Buy recommendations? Is there instead a plethora of Sell recommendations on these extremely expensive stocks? (That is a rhetorical question by the way, which I think we all know the answer to!)
As usual, the “answer” will be supplied by the Fed, whose liquidity is the only thing that deciding how much more time everyone has to “dance.”
