Fra Zerohedge/ SocGen:
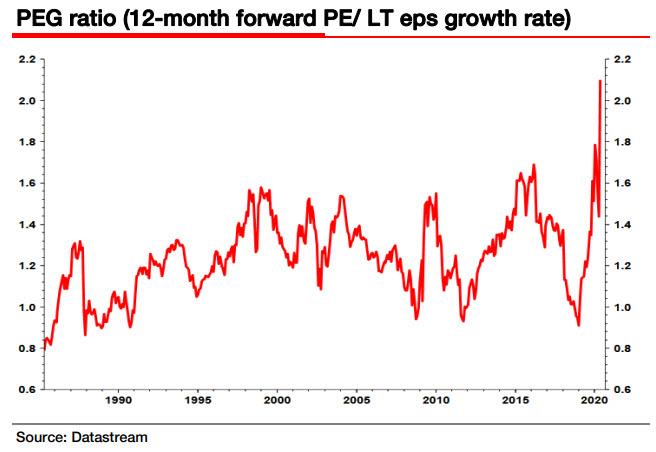
While Edwards admits that there are many ways to show “how ludicrous current equity valuations have become and by implication how vulnerable equities are to a collapse”, the SocGen strategist avoids focusing on the “ubiquitous chart” shown above which shows the rise in the S&P500 12m forward PE above 20x driven by the ongoing profits collapse – after all we did that just yesterday highlighting the “Idiotic Disconnect Between Markets And Reality” – to Edwards the real show-stopper is a different chart, one which shows on one hand the continued Ice Age slump in analysts collective expectations for long-term eps growth, and on the other the soaring PE ratio. The combination of the two is what is also known as the PEG, or Price to Earnings Growth, ratio.
Looking at the first component, long-term, EPS growth, Edwards notes that it “has now slid below 10%, a trend only likely to accelerate during the current profits slump.” This is shown in the chart below.
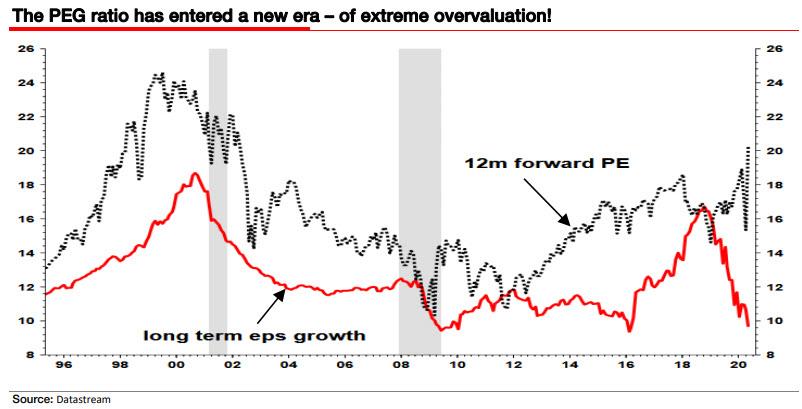
Looking at the chart above, Edwards urges readers to compare the current LT EPS situation with the late 1990s tech bubble, when – like now – “the S&P forward PE rose above 20x, but at least back then the cycle was still intact, and as technology stocks increasingly dominated the index, the markets LT eps was also surging higher in tandem with the rising PE.”
As he further explains, at least back in the tech bubble, the market had a LT eps leg to stand on “albeit a wooden leg, riddled with woodworm.” By contrast, this time around, despite technology stocks once again dominating the index, something Goldman warned two weeks ago always ends in pain, “the 20x PE is based on nothing more than an ideological dream.”
The dream he is referring to, is one spawned by the destructive ideology of MMT (i.e., the Magic Money Tree), where the merger of the Treasury and Fed, and the joint issuance and monetization of debt, magically creates an economic perpetual engine and social utopia… for at least a short while before the currency collapse. No wonder this ideological dream is that anchor pillar of socialists who wish to pass off as financial gurus.
In any event, going back to the chart above, when one combines the two data sets, one gets a snapshot of the so-called PEG ratio (the ratio of the P/E to Long-Term eps growth) which as Edwards notes, has risen above 2x for the first time ever, which prompts the stunned strategist to exclaim that “this is even more shocking than a 20x PE!”