Fra Zerohedge/ Goldman:
“Fiscal Cliff +Peak Fed = Second Leg of Correction”
Morgan Stanley
Back in March, just after the Fed nationalized the bond market, Morgan Stanley’s Michael Wilson quickly emerged as the biggest cheerleader for risk assets, correctly predicting that stocks would soar on the back of the biggest surge in global fiscal and monetary stimulus which according to BofA estimates is now well over $20 trillion.
Well, the party is now over.
As Wilson writes this morning, over the past few weeks US equity markets have experienced their largest correction since the new bull market began, and according to Morgan Stanley – which still sees the bull market continuing albeit at a slower pace – not only is this “correction due to the rally simply exhausting itself into long-term resistance” but the second leg of the correction has arrived.
The MS strategist also writes that “the correction also coincided with disappointing progress on the passage of CARES 2 and a very clear message from the Fed that it does not plan to enact yield curve control as they implement average inflation targeting. The Fed followed up that messaging this past week with further disappointment for bond bulls by not providing any formal guidance on their plans for QE.”
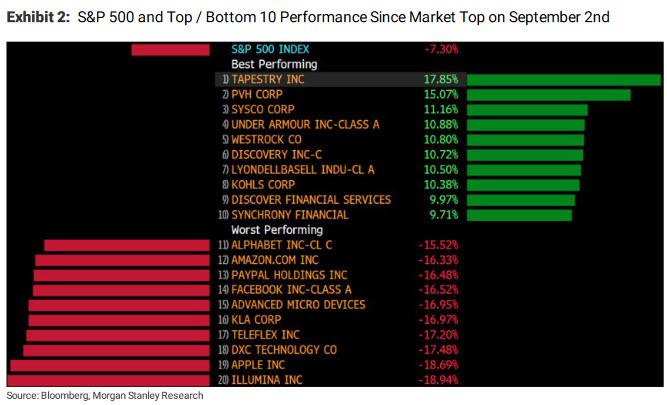
Focusing on the catalysts behind the correction, which Wilson says began on September 2 when equity markets failed to break through formidable longer-term resistance – he says that it simply followed markets going “parabolic” for “no reason.”
Well, not “no reason” – as the strategist adds, at this point “everyone understands the speculative drivers from both retail and certain institutional buyer(s) of call options [ZH: read SoftBank] in large cap technology stocks. The subsequent reversal of that speculation was naturally concentrated in those stocks too.”
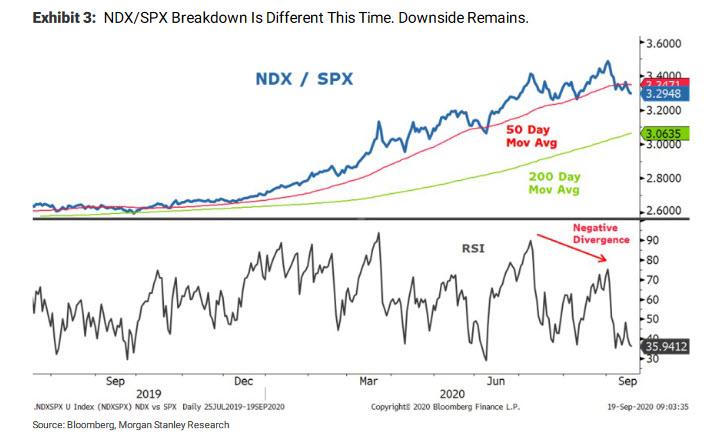
Next, as Wilson studies the correction from a technical standpoint, he can’t “help but notice how the NDX is finally breaking down on a relative basis. We think the breakdown began in early July. In fact, the NDX/SPX ratio broke down in July during earnings season as investors “sold the news” on the basis of valuation and very high forward expectations.”
However, the ratio quickly regained its 50-day moving average and then made new highs in what can be described as a blow off top in August. Fast forward to today when that same ratio is now breaking down in a way that is different than the recent past:
- First, it took out the 50-day moving average in the first leg of this correction and then failed to recapture it on the subsequent rally. Instead, it rolled over again and is now making new lows.
- Second, the negative divergence on the blow off top was significant.
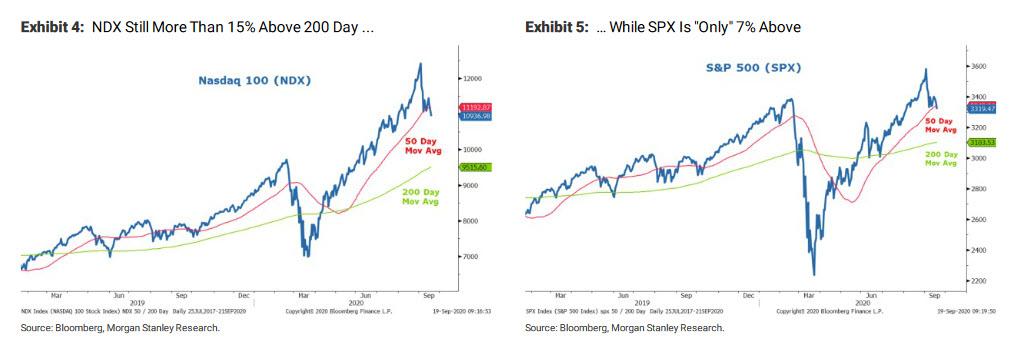
This all suggests to Morgan Stanley the correction isn’t over and is in fact, restarting after the brief pause in the past two weeks: “while corrections in uptrends are to be expected and healthy, the next line of defense/support is considerably below Friday’s close (Exhibit 3). This is what happens when stocks get so extended – corrections can be much bigger while remaining in an uptrend.”
The same logic applies to both the Nasdaq and S&P 500 on an absolute basis, as shown in the next two charts, “as both indexes got too extended in August on speculative behavior from novice investors” with MS arguing that “this speculation needs to be wrung out before the bull market can continue.”
That said, Morgan Stanley’s Quantitative and Derivatives Strategy team notes that the declines are turning more orderly as short gamma exposures moderate – 5-day realized vol for QQQs fell to 27% this week from 56% on Sept 9th – something we touched on last week. Nevertheless, speculation clearly remains rampant in some areas, as witnessed by first-day performance of tech IPOs and other “spec” stocks.
Retail investors aside, institutional exposure also remains remarkably high, particularly in the context of higher realized volatility. According to Morgan Stanley’s Prime Brokerage Team, both Net and Gross Exposures are near the top decile of the past decade and when it is beta adjusted, it is even higher.
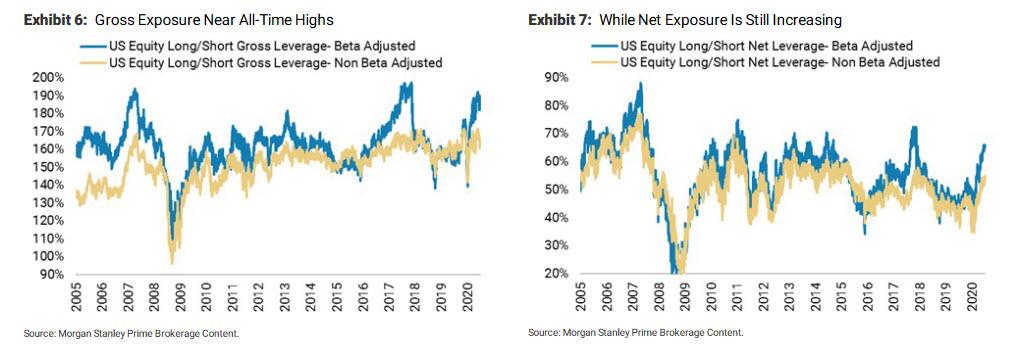
Drilling down, Wilson finds that from a sector and style perspective, hedge funds remain decidedly long tech/growth, which explains many hedge funds’ relatively strong performance YTD – at least relative to the S&P 500 (+4% YTD), if not the Nasdaq 100 (+26%). Which is also why the coming Nasdaq flush will prove especially painful.
This abnormal tech concentration may also explain why both gross and net exposure remain high even with realized volatility also near the highest levels of the past decade and expected to remain so through the election: “Many funds that are long tech/growth have significant P&L to play with and are letting it ride, not to mention this has been the right strategy for the past decade.”
Wilson thinks that may come into play and provide even more fuel for this correction to go a little further than most are expecting. Supporting this view is the fact that the beta for the NDX has declined sharply over the recent past, making many portfolios appear less risky than they might be should that revert back to “normal.”
With the NDX 1-year rolling beta at just 0.91, “that reversion could be swift and meaningful.” The long-term average beta for the NDX is closer to 1.25 and is being artificially suppressed in Wilson’s view by the fall in real long-term interest rates and pull forward demand for many tech companies due to the COVID lockdown.
Making matters worse, a further reopening of the economy and higher nominal and real rates “will be the trigger for this reversion in beta and could feed into more aggressive reductions in both gross and net exposures given how many portfolios are currently skewed toward tech and growth stocks”, Wilson concludes.
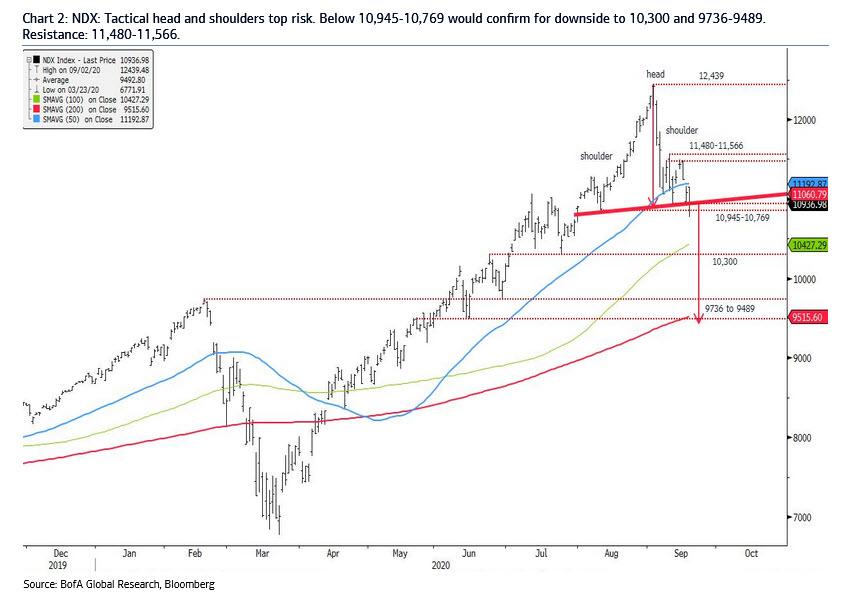
Picking up on the technicals, BofA chief charist Stephen Suttmeier writes that just like the S&P, “the NASDAQ 100 (NDX) shows the risk of a tactical head and shoulders top” adding that while below first resistance at 11,535-11,566, key nearby support at 10,945-10,855 is exposed to downside risk.
“The NDX failed to regain that resistance and enters this week pressuring support, with Friday’s low at 10,769, where a decisive break would suggest a tactical head and shoulders top and deeper risk to chart support at 10,300 and the prior high from February at 9736.”
* * *
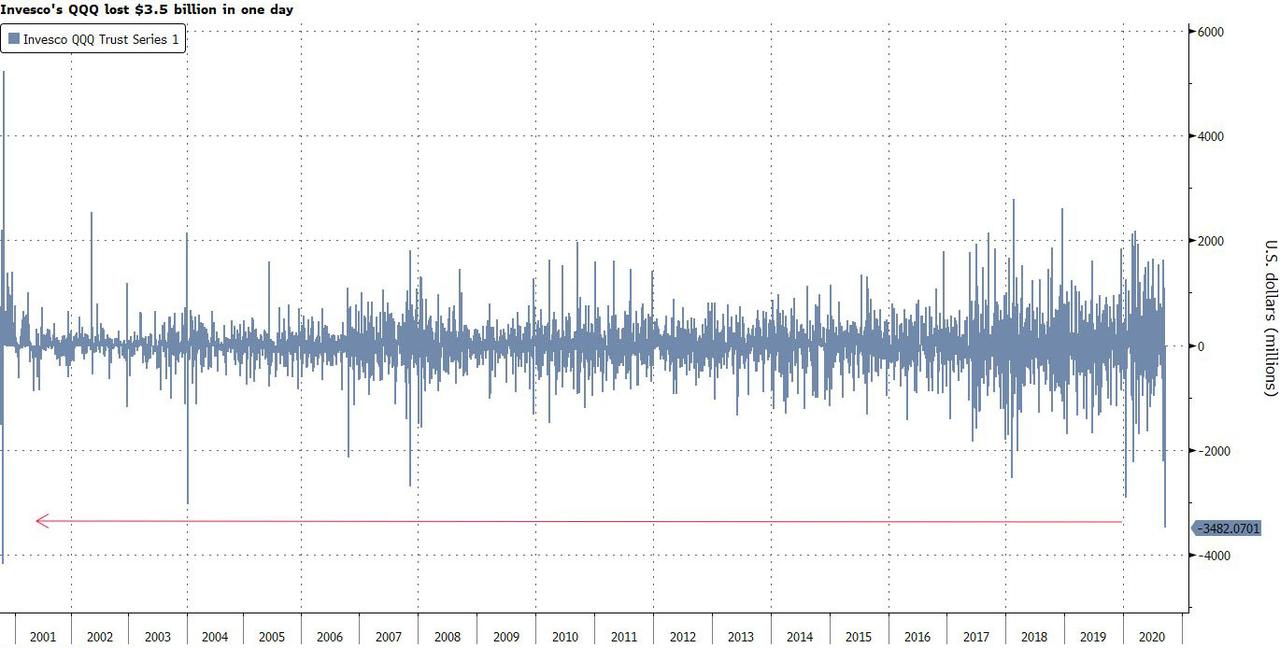
Finally, none of this appears to be news to investors, because one week after a massive inflow into tech funds (as discussed last week), this morning Bloomberg notes that investors are dumping the largest tech ETF at the fastest pace in 20 years. Specifically, the $122 billion Invesco QQQ ETF suffered its biggest daily outflow since October 2000, losing almost $3.5 billion on Friday.
“There is more of a concern that in equity markets we shouldn’t be priced to perfection anymore,” said Brian Nick, chief investment strategist at Nuveen. “That’s the pullback you’re really seen, especially with the stocks with the higher valuations.”
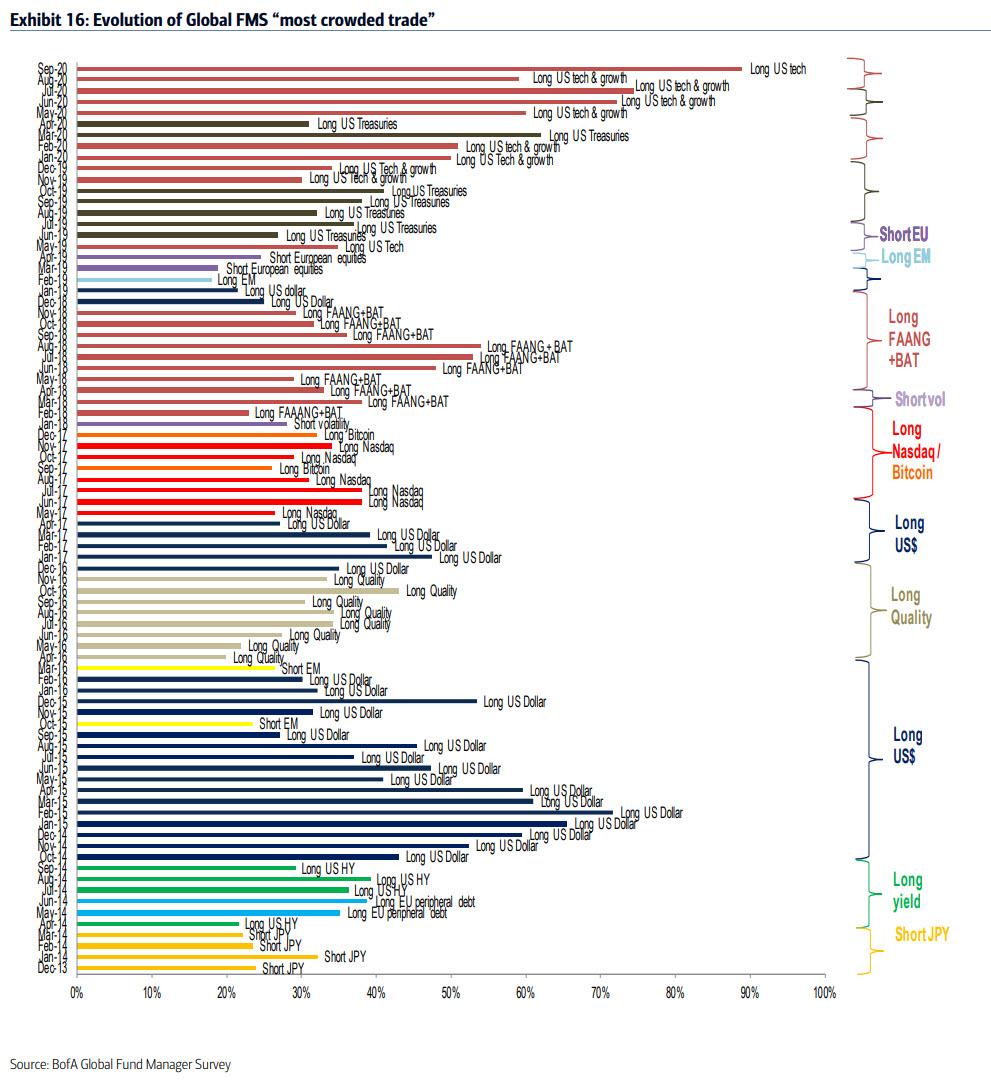
Not exactly surprising, this comes just as the latest Fund Manager Survey published earlier this week found that Wall Street is “paranoid tech” because when asked what they think is the most “crowded trade”, 80% – an all time high consensus – said “long tech”…
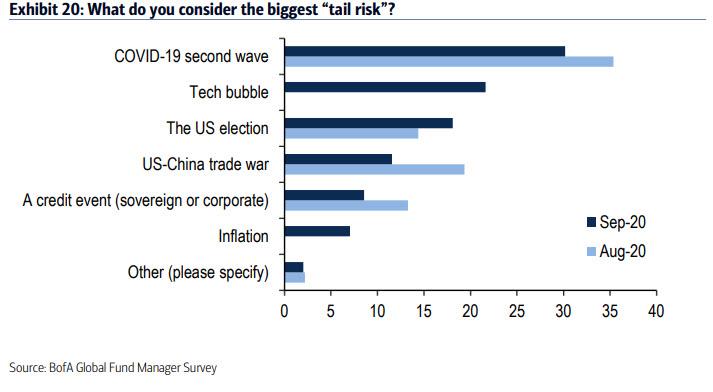
… with fund managers declaring that the “tech bubble” is now the second biggest tail risk for the market after a “second wave” of COVID-19.
For once, Wall Street may have been right.
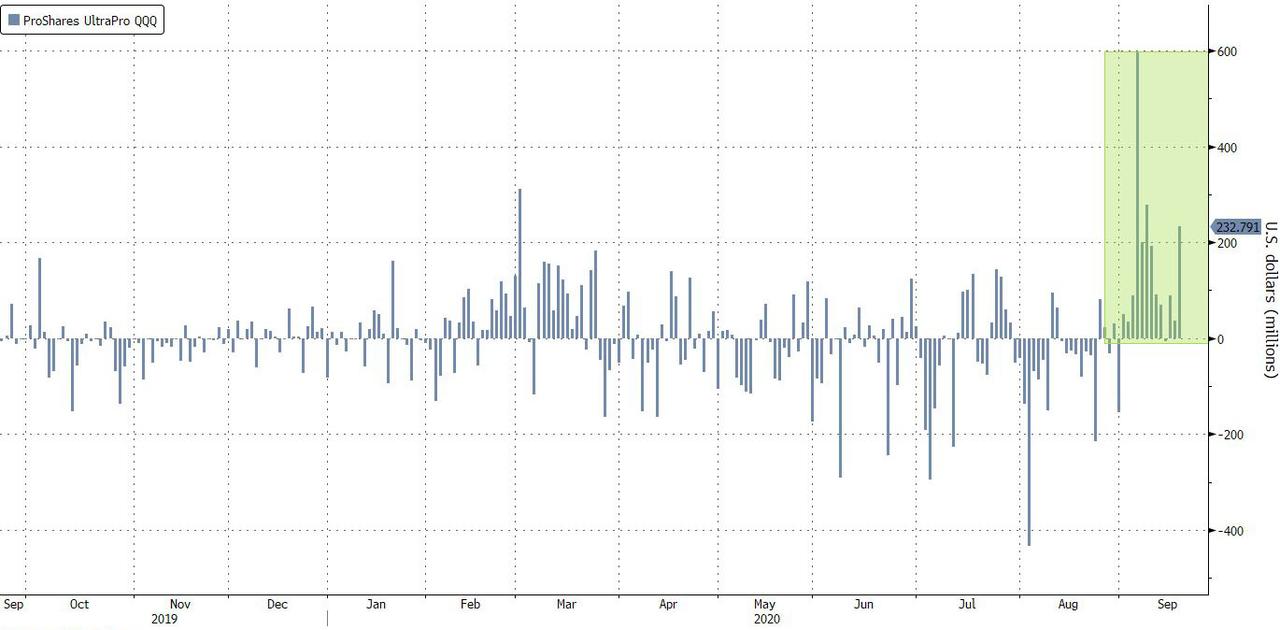
But if Wall Street was correct, Robinhood’s habit of buying every f**king dip is about to crush it, because at the same time as institutional and NHW investors were dumping QQQs, retail investors piled into the triple-leveraged version of QQQ that’s become popular among day traders (which we noted last week in Robinhooders Discover 3x Levered ETFs), as the $7.9 billion ProShares UltraPro QQQ notched a third straight week of inflows.