
Fra Zerohedge:
MUST READ
Regular readers know that it has long been our contention that – under the current regime of debt-fueled growth – one of the clearest indicators of future economic growth is the present credit impulse. It’s why in 2017, not long before the Fed pushed rates so high the market suffered its first mini bear market – we warned that “The Global Credit Impulse Suddenly Collapsed To Negative.” Global GDP growth peaked shortly thereafter with China’s output hitting new all time lows – well before the coronavirus ground the world to a halt – urgently mandating an “exogenous event” that would greenlight an unprecedented credit injection. Fortuitously, the covid pandemic proved to be just such an event.
So where are we currently, now that in just the past 3 months we have seen a gargantuan $18+ trillion in fiscal and monetary stimulus, equivalent to just over 20% of global GDP?
It should hardly come as a surprise that as a result of this unprecedented firehose of credit-enabling liquidity, the recent spike in the credit impulse has been the greatest in history. Yet for the first time, GDP is not keeping pace.
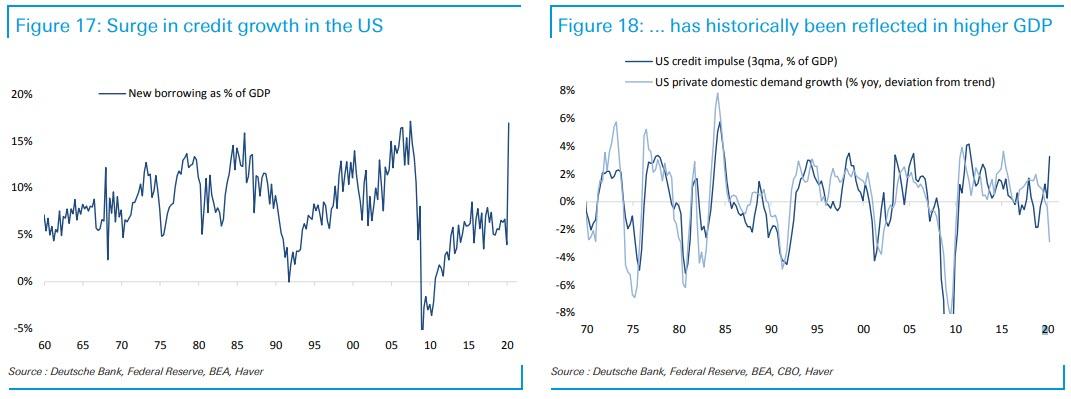
As Deutsche Bank’s Francis Yared writes in the latest Fixed Income Weekly report, “credit growth and lending surveys have historically been good indicators of underlying GDP growth.” However, “the sharp divergence between credit and activity observed in the US, the eurozone and China is particularly unusual and highlights how different this crisis is relative to the GFC.”
Yared is referring to the following charts: first, the US credit impulse.
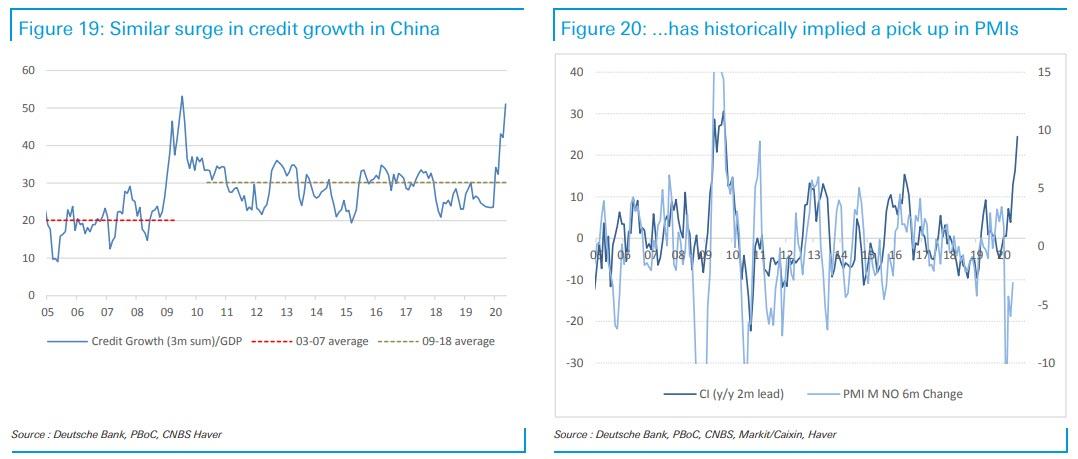
Then China…
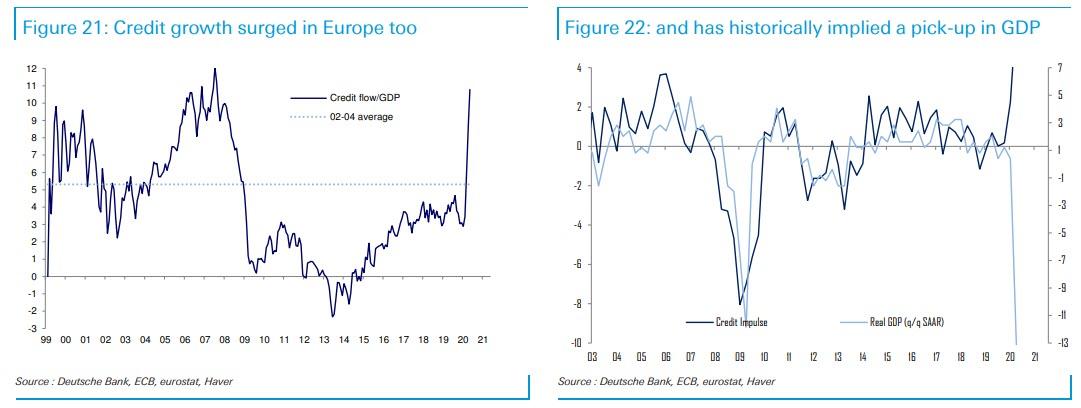
… and finally Europe:
What to make of the above observations, when coupled with the ongoing contraction in global GDP?
There are two alternatives: i) either the credit impulse will have a massive impact on global growth, although somewhat delayed until the credit ends up in the broader economy unless of course it remains stuck in the stock market which has already wiped out most of its covid-losses, or ii) we are well and truly in a “newer abnormal”, one where even drowning the world in cheap debt fails to boost GDP.
The economic establishment has bet its credibility on the first alternative: after all, if neither fiscal nor monetary stimulus (as we explained recently) is inflationary or stimulatory, it means that the entire Keynesian economic paradigm can be thrown out. Needless to say, that would have unprecedented consequences for the world.
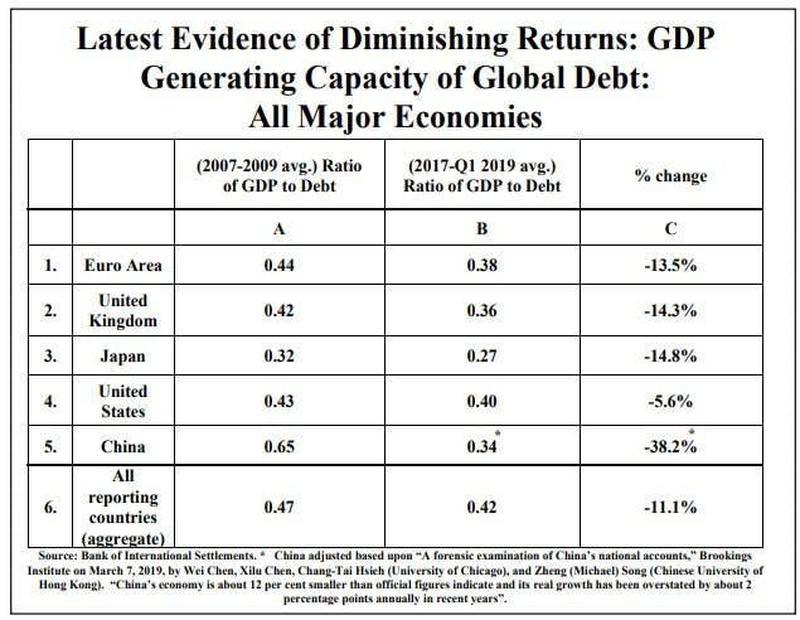
“Impossible”, some may say, but is it really? Recall that just one month ago we pointed out that the the marginal utility of debt has collapsed to all time lows, as it takes ever more debt to result in economic growth, which is just another way of saying that the positive economic impact from any outsized credit impulse is virtually nil.
For those who missed it, here is our recent analysis on why “QE No Longer Stimulates The Economy And Only Leads To Higher Stock Prices”.
Even some of the most ardent supporters of the fraud that is Keynesian economics now admit the entire modern economic system is on the verge of collapse for one main reason: the marginal utility of debt is collapsing, with ever more debt required to generate an increase in underlying GDP.
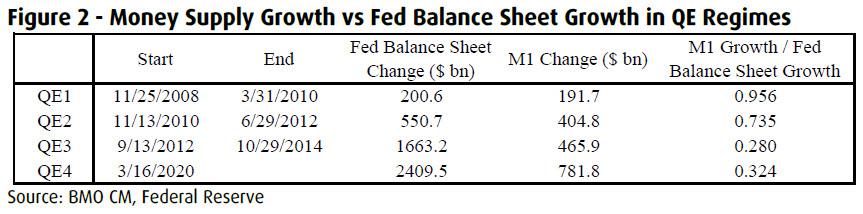
And tied to that, is another reason why any day now the current system may be the last: the marginal utility of every new QE is now declining to the point where soon virtually none of the money created by the Fed out of thin air will enter the economy and instead will be stuck in capital markets, resulting in hyperinflation for asset prices even as the broader economy collapses. Or, as BMO’s Daniel Krieter writes, “QE has fed through to the real economy in a slower manner than previous QE campaigns” and for each dollar the Fed’s balance sheet has grown, M1 money supply has increased about $0.32, compared to $0.96 and $0.74 in QE1 and QE2. “The expansionary policy thus far has mostly resulted in increased asset prices”, BMO writes concluding what had been obvious to us and our readers since 2009. Only now we are ten years closer to what is the inevitable endgame, one where the Fed has no impact on M1, which will also be known as the “game over” phase.
But let’s back up.
Traditionally, as BMO explains, we analyze the business cycle from a classical economic perspective where monetary authorities are more passive and “the invisible hand” guides economies (this used to be the case before the Fed went all Politburo on the USSA and decided to nationalize capital markets, crushing any “signal” the bond market may have; the final step will be the launch of Yield Curve Control which will be game over for the market).
In this context, we look at interest rates, which can theoretically be defined as the rate that makes the consumer indifferent between consumption today and consumption tomorrow. R* is the (unknowable) natural rate of interest that supports full employment and stable interest rates. In theory, if r<r*, then consumption today is preferable and the economy is expanding. If r>r*, consumption saving is preferable and the economy is contracting.
In an expansionary phase, prices and consumption are increasing. Because prices and investment opportunities are high, demand for money among consumers/businesses is high, and interest rates (r) increase alongside borrowing. When r rises to the rate of r*, consumption slows, earnings fall, and a recession ensues. R* falls as uncertainty and risk aversion grow. This is a “business cycle” recession (and as long as the Fed is around, we will never have one of those again as the Fed has now also killed the business cycle… just as the USSR tried to do).
However, a recession can also be caused by some external shock to the economy that produced further declines in r*. This is because r* is reactive to uncertainty with a strong negative correlation. The greater the uncertainty, the lower r* falls.
In recession, r falls as consumption remains low as long as it is greater than r*. Defaults accelerate the drop in r. With the passage of time, r* rises slowly as the uncertainty/risk aversion surrounding the shock and/or end of business cycle fades. However the longer firms go without earnings due to low consumption, the more defaults are realized and the more r drops. At some point, the combination of falling r and rising r* results in r <= r*. Once this happens, consumption/ investment picks up and the economy enters recovery.
In addition to accelerating declines in r, defaults experienced during recession also lower the cost of labor and capital goods as the resources of failed companies are returned to the economy. In addition, barriers to entry in certain industries fall as “old guard” firms go out of business. Thus, as the economy enters recovery, this combination of cheaper labor/capital goods and lower barriers to entry leads to strong business investment and increases growth potential during the ensuing expansion.
This is how the world works in theory. Unfortunately, since 1913, theory has not worked due to the intervention of the Fed. So now let’s look at how all this works in reality, and introduce an active central bank with a wider range of monetary policy tools at its disposal.
As the economy cools, the central bank lowers r in an attempt to spur consumption by forcing r<r*. Consumption increases in response, and recession/defaults are avoided. But business resources aren’t returned to the economy. Recovery will be less robust due to fewer relative attractive investment opportunities. As Krieter argues, this was the experience of 2001.
Now in 2008, a shock in the form of subprime mortgages hits the economy and uncertainty skyrockets. R* moves into negative territory as shown in a recent San Francisco Fed study. The Fed moves rates lower, but is constrained by the zero bound. In order to further “lower r”, the Fed embarks on asset purchases during QE and is successful in spurring consumption, as evidenced by the strong correlation between increases in excess reserves and increases in M1. M1 is the most basic measure of money supply and includes essentially only cash and checking/demand bank accounts.
The theory is that for a good or service to be consumed, it must be paid for out of M1. Therefore, the increase in M1
following QE is a measure of the degree to which QE results in actual consumption.
Note “lower r” in quotation marks in the previous bullet because r is at the zero bound and cannot (at least in the United States) be lowered further. Therefore QE increases money supply which is meant to spur consumption, which is the same desired effect of lower interest rates. In a sense, money supply increases are synthetic interest rate decreases (and synthetic capital market increases).
The combination of QE-driven consumption (r falling) and fading uncertainty after a trillion dollar fiscal stimulus package (r* rising) ultimately pulls the economy out of recession. However, the pace of response in 08/09 was slower. QE was not announced until late November 2008, after large defaults were already experienced. Fiscal stimulus in the form of the ARRA package didn’t arrive until February 2009 with an additional lag in implementation that featured incremental defaults. In the end, almost a trillion dollars’ worth of debt was affected by default in 2008/09, but QE certainly prevented actual defaults from being likely exponentially greater. BMO notes however that defaults avoided were once again economic resources that were not returned to the economy and barriers to entry that are not lowered. This argues that attractive investment opportunities following the financial crisis were not as abundant as the depth of recession would suggest.
As a result, the recovery was slow, ultimately prompting the Fed to embark on additional rounds of quantitative easing in an attempt to spur increased consumption.
Which brings us to the seeds of the Fed’s own demise: the problem is that QE appears to be experiencing diminishing returns, as evidenced by a falling correlation between excess reserves and M1 in successive episodes of QE following the financial crisis. As QE leads to a direct increase in bank reserves, only a fraction is translated into money supply growth, and thus potentially consumption and investment. QE1 was highly effective and an important factor behind pulling the economy out of recession. QE2 had a marginally lower, but still high, follow through of .735 indicating that on average, $0.74 of each dollar of QE translated to increased money supply. We observe elevated inflation and personal consumption rates during the period of QE2 as evidence of its effectiveness. However, during Q3, the correlation fell to just $0.28 and resulted in very little inflation of GDP growth. Through this lens, the impact of QE on the real economy has diminished over time.
How does BMO explain the diminishing impact of QE?
- Diminishing marginal utility of consumption: QE (and monetary policy) is often referred to as “borrowing from the future”. However, there is only a limited amount of future consumption that can be pulled into the current period via monetary policy. This could apply to consumption of durable goods: as rates have been relatively low for a long period of time, demand for credit no longer increases at the same rate with incrementally lower interest rates. At some point, consumption does not bring sufficient to utility no matter how long prices or interest rates are.
- Wealth disparity: Wealth disparity exacerbates the impact of diminishing marginal utility of consumption. For reasons discussed in further detail below, QE tends to inflate the price of financial assets, making those who own the assets more wealthy. A large percentage of QE money ends up in the hands of the wealthy, whose consumption patterns are unlikely to change in response to a near term increase in wealth.
- Inflation expectations: Finally, the crux of monetary policy plays on expectations. Inflation is self reinforcing as demonstrated by a very high correlation between inflation and inflation expectations. Around the introduction of QE, there was an expectation that it could spawn runaway inflation. Having been through multiple rounds of QE without a large increase in inflation, people have likely generally come to understand that QE is not likely to result inflation, therefore there is marginally less impetus to consume now.
Following five years of no QE in the United States, it appears the utility of current QE has increased modestly in comparison to QE3. However, the follow through to consumption still remains well below levels experienced between Q1 and Q2. It is likely then that current QE is unlikely spurring much consumption as r isn’t influenced lower (via money supply increase) as much as in the past and likely remains well above r*.
Worse, as we discussed last week, one can argue that r* is likely lower now than potentially any point in history, and according to Deutsche Bank it is at an all time low of -1%.

Not only is uncertainty extremely high, but the impact of COVID-19 arguably directly lowers r*. Recall r can be defined as the rate of interest that makes consumption today indifferent to consumption in the future. In all economic models, r is assumed to be positive. But when people are afraid to their leave their house for fear of infection, future consumption actually is more attractive than current consumption. So r* is arguably negative for fundamental reasons for the first time. Greatly heightened uncertainty only pushes it even further negative.
When money supply goes up, but consumption fails to be generated (because r remains well above r*), then savings rates mathematically increase. Therefore, the prices of financial assets increase generally.
During times of risk aversion, bond prices increase first, but supply of safe assets is limited, especially as the Fed buys a substantial portion of the Treasury market. Investors are therefore pushed into riskier assets. But as long as r remains below r*, the more savings go up, the greater the mechanical move in financial asset prices relative to real economic activity.
This, according to BMO, is what’s driving the paradoxical relationship between bond and equity prices in recent weeks, and explains why stocks are performing so well despite the outlook for the greater economy. Money supply that doesn’t translate into consumption must result in higher financial asset prices until defaults result in wealth destruction. What does this mean for the recovery? The central bank is displaying reduced capacity to further generate real economic activity as a result of accommodative policy over the past twenty years. This means that recovery is unlikely until r* increases significantly, which only happens alongside fading virus uncertainty. This will take a long time.
During that time, one of two things will happen. Either the government will continue to assist companies in avoiding
bankruptcy, or it will not. If it does, confidence (and r*) will likely return relatively more quickly at a huge cost to the government. However, there will not be a large return of economic resources at the end of this recession and the ensuing recovery will be disappointing given the degree of economic pain currently being felt.
If it does not, defaults could potentially reach historic proportions, and the recession will be long and painful. However, using the “ripping the bandaid” analogy, this scenario would result in likely the largest return of economic resources in the history of the country and lead to a very powerful economic expansion in the wake of the current recession.
Ultimately, the truth likely lies in the middle. The government will continue to provide relief, though not likely in scale large enough to save all businesses. Defaults and downgrades will be staggering, but this will increase the capacity of growth in the ensuing economic recovery.
What does this mean for risk assets? It means that risk assets are being technically supported by stimulus measures so far, particularly QE that is no longer as effective as it was. However, a large wave of defaults is unavoidable without an unlikely near-term (and complete) solution to COVID-19. Heavy defaults, the kinds described in “Biblical” Wave Of Bankruptcies Is About To Flood The US, will likely bring about another wave of risk asset price weakness as wealth is destroyed and technical upward pressure on financial asset prices and a higher percentage of savings demand is met with safe haven assets (Figure 3).
This also explains why the Fed was compelled to enter the bond market, as absent a direct intervention in the secondary market, bond prices would crater and trigger a self-fulfilling doom-loop, where lower bond prices lead to higher defaults, lead to even lower prices and so on.
For now, the Fed has managed to delay this process but there is only so much Powell can do to offset the collapse in fundamentals which will lead to continued ratings erosion, and the eventual defaults of countless companies, many of which the Fed will be directly invested in. At that point, the Fed’s action in the “market” will become the topic of non-stop Congressional hearings, and will culminate with doubts emerging about the viability of the dollar as a reserve currency.


