
Fra Seekingalpha – læs resten af artiklen her
Summary
Strong demand for container shipping emerged in 2017 following a dismal 2015 and lackluster 2016.
This gave a bit of hope that the segment might be on the road to recovery.
But is the storm really behind us?
—-
An oversupply of container vessels has plagued the market over the past couple years. But late 2016 through the first half of 2017 saw robust demand for these ships as the global economy picked up pace. This led to speculation that the container shipping segment was on the road to recovery.
But the back half of 2017 saw rates decline again even as demand remained relatively strong. While we have seen a bit of an uptick to start 2018 there is still a large orderbook set to hit the water which the market may find difficult to digest.
The main damage to the container shipping segment was brought on by a massive influx of Ultra Large Container Vessels, ULCVs, so we will focus our attention there.
Some of the container ship companies traded in the U.S. market include Seaspan Corporation (NYSE:SSW), Costamare, Inc. (NYSE:CMRE), Diana Containerships, Inc. (NASDAQ:DCIX), Global Ship Lease, Inc. (NYSE:GSL), Danaos Corporation (NYSE:DAC), Ship Finance International Limited (NYSE:SFL), and Navios Maritime Partners L.P. (NYSE:NMM).
Ordering Spree
Since my last container shipping supply side update in July of 2017 quite a few orders have been placed which has added to the concern surrounding the already thick orderbook.
From January through July of 2017 orders were kept largely under control with just 14 firm orders and two options placed over that time, all for vessels of 2,525 TEU or less. Owners were exercising an enormous amount of restraint as the industry struggled to cope with the oversupply situation.
But this restraint ended in a big way throughout the back half of 2017 when an exceptionally high number of vessels were contracted, many of which were ULCVs.
From August through December, there were 69 firm orders with 7 additional options. Many of these were smaller vessels, such as feeders, handy class, and sub-Panamax. But there were also five orders for 11,000 TEU vessels, six orders for 14,000 TEU vessels, and 20 orders for 22,000 TEU vessels with 3 additional options. The vast majority of these are set for delivery in 2019 and 2020 and the addition of these vessels has altered the outlook.
Not only must we reassess the outlook based on these orders but a high degree of deliveries over 2018 will further add to the supply woes for the segment before these new orders even hit the water.
2018 Incoming
Let’s start with a bit of history to put these upcoming deliveries in context. The current depressed charter market can be traced to the addition of several ULCVs starting in 2014.
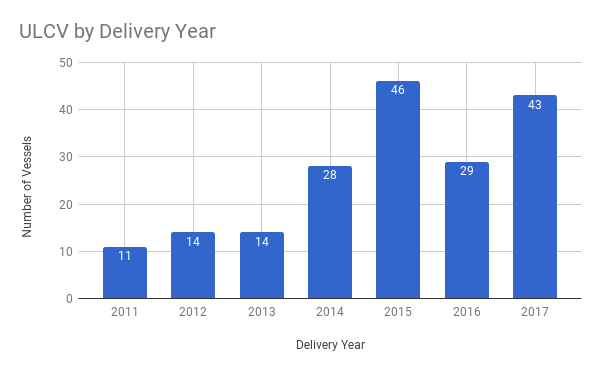
Source: Data Courtesy of VesselsValue, Chart by James Catlin
On the surface these numbers don’t look too staggering but when we dive into the number of TEU they represent, it’s a different story.
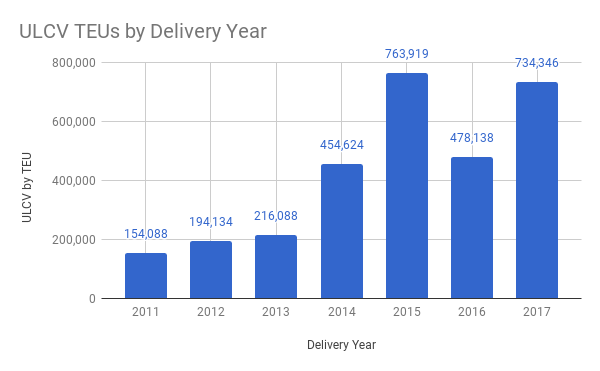 Source: Data Courtesy of VesselsValue, Chart by James Catlin
Now let’s recall how these deliveries impacted the segment. Over the course of 2015 we saw rates collapse by approximately 75% across the board. While they have bounced back a tiny bit, thanks in part to layups, consolidation, bankruptcies, and an uptick in demand they still are a fraction of what they were prior to this recent delivery cycle.
So why am I so concerned about 2018?
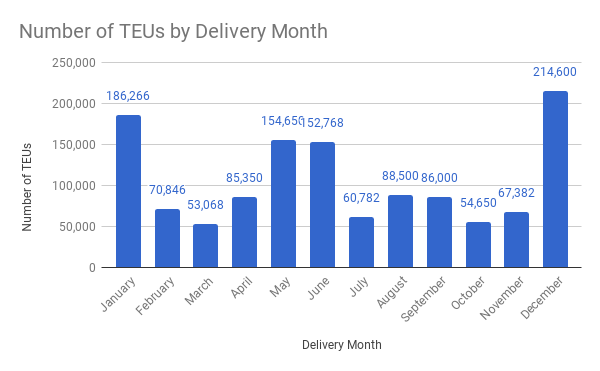
Well let’s take a look at the number of vessels expected over the course of 2018 in the ULCV class, as well as TEU.
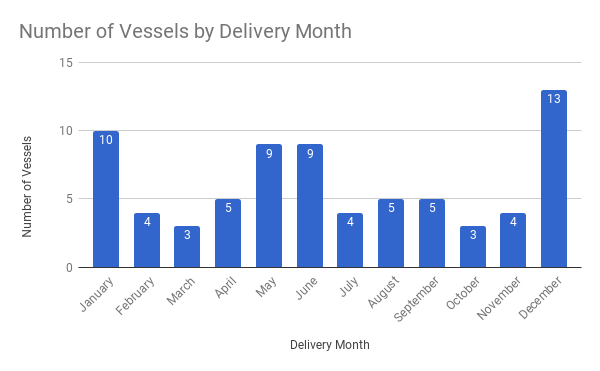 Source: Data Courtesy of VesselsValue, Chart by James Catlin
 Source: Data Courtesy of VesselsValue, Chart by James Catlin
There are 74 deliveries of ULCVs scheduled for 2018 representing 1,274,862 TEU that will hit the water. That’s two vessels and 62,378 TEU more than 2016 and 2017 combined.
Now if we were to add up expected TEU across all classes that comes out to 1,978,932. This comes out to approximate gross TEU growth of 9.5%. Accounting for slippage and expected demolitions will likely put net fleet growth closer to 1.4 million TEU which still represents 6.7% net growth. This supply side growth eclipses the robust demand side activity we have seen as of late.
Of course, owners are currently attempting to balance deliveries, as noted in my last article, but as recent history shows even a slight imbalance can send rates lower.
