
kursgraf: Baltic Dry Bulk indeks har på det seneste vist stor svaghed. Afvent evt køb af DS Norden.

Fortunes rise and fall fast in ocean shipping. Easy come, easy go. Case in point: Dry bulk spot rates were surging throughout June and the first week of July. Today, they’re on a steep slide.
“Levels for the big ships are spiraling downward,” brokerage Fearnleys wrote in its weekly report.
“Every rally is followed by a correction, something that is currently taking place following one of the strongest rallies in recent memory,” commented Breakwave Advisors, creator of the BreakWave Dry Bulk Shipping ETF.
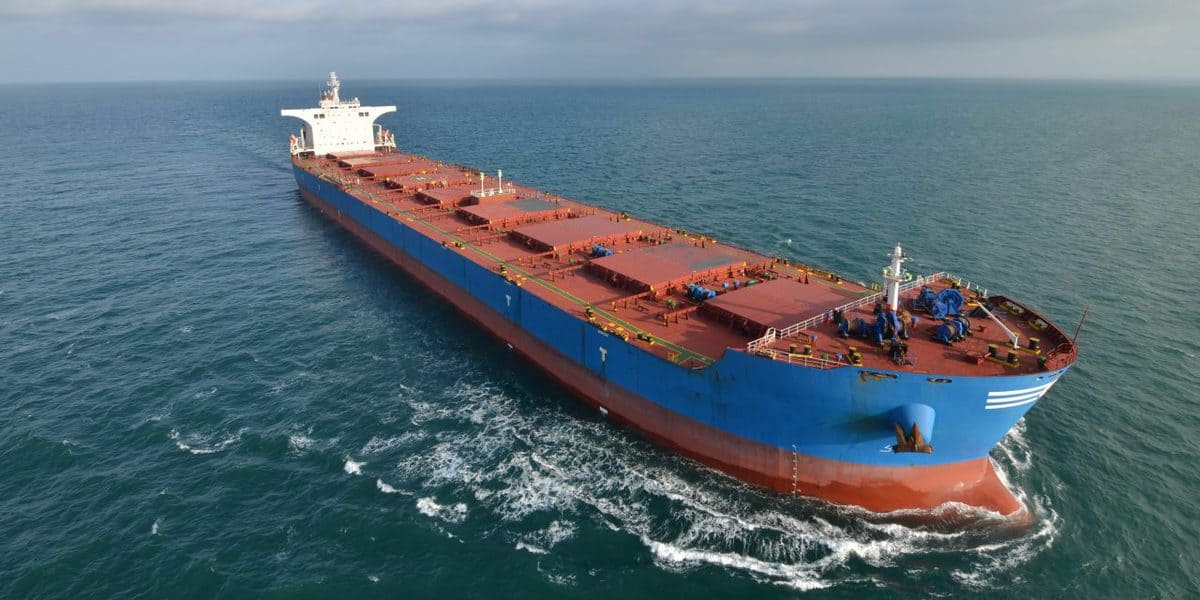
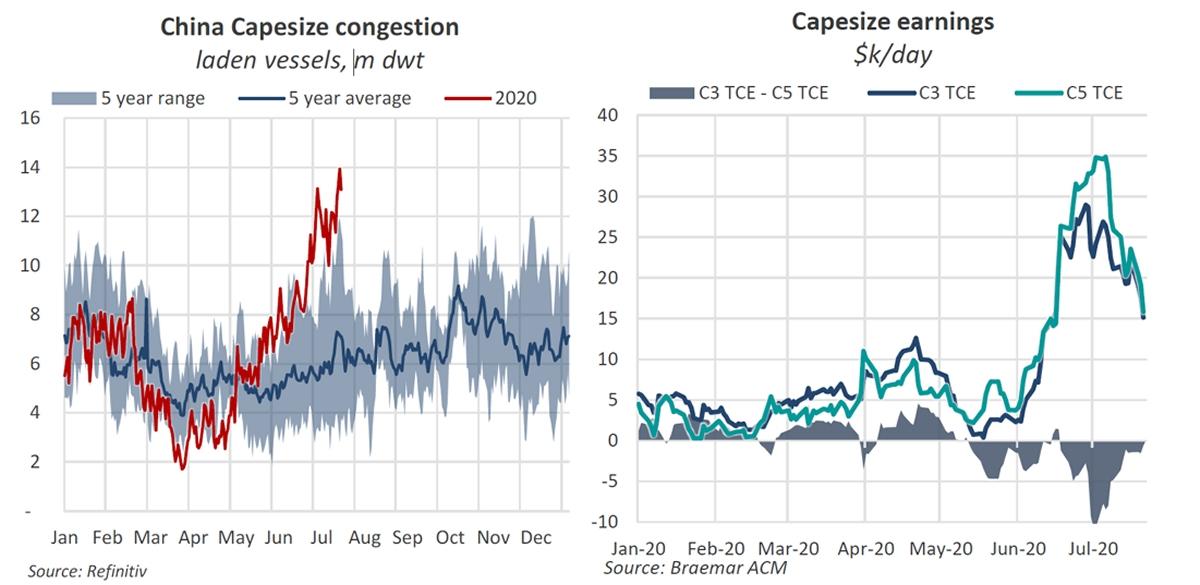
Rates for Capesize bulkers (ships with capacity for around 180,000 deadweight tons or DWT) were down to $17,300 per day on Friday, according to Clarksons Platou Securities. That’s about half the recent peak of $33,800 per day on July 6 and down 39% year-on-year. Listed owners of Capesizes include Star Bulk, Golden Ocean, Genco Shipping & Trading and Seanergy.
Rates for Panamaxes (65,000-90,000 DWT), the vessel type used to transport bulk U.S. farm exports, are down to $11,400 per day, 40% below where they were a year ago.
Bullish backdrop
Two trades largely drive Capesize rates: Australia-China and Brazil-China iron-ore transport. Rates hinge on how many Capes are in one basin versus the other, and how much iron-ore volume comes out of Australia versus Brazil.
The fall in dry bulk rates is happening amid seemingly bullish news. First, there’s a massive congestion pileup at Chinese ports. Congestion takes ships out of the spot market.
Braemar ACM Shipbroking, using vessel-position data from Refinitiv, calculated that laden Capesize tonnage waiting to discharge in China reached 13.9 million DWT at the beginning of this week. That is the highest level recorded since vessel-position data has been available and almost quadruple 2019 levels.
Other positives: Chinese daily steel production recently hit record levels, implying strong demand for iron ore and coal. Also, new crew-change regulations are slowing vessel operations in Australia, a negative for ship capacity. And furthermore, iron-ore exports of Brazilian miner Vale are coming back to life. Vale recently reaffirmed guidance for substantially higher volumes in the second half.
Why Capes are falling
FreightWaves asked Nick Ristic, lead dry cargo analyst at Braemar ACM Shipbroking, why Cape rates have fallen despite all this. “I think it boils down to the fact that the Australian shippers were pumping out as much volume as possible at high prices in June, ahead of the end of the Aussie financial year — for most of them — and before scheduled maintenance in July,” he explained.
“The supply of Capes that could cover these dates thinned out pretty quickly, hence the hefty premium they commanded. The worries over supply of freshly crewed ships following the crewing regulation announcement [in Australia] also temporarily drove a premium for some vessels.”
On the rate drop that followed, he said: “The pace of Australian shipments dipped and there didn’t seem to be the scramble for tonnage that we saw in June.”
Concerns over crew-regulation delays in Australia “eased pretty quickly,” he added.
“China queues have increased, but so has the number of ships discharging, and then rejoining the Pacific market,” he continued.
The number of spot ships available in the Pacific was also boosted by what was going on in the Atlantic.
In early July, Capes on the Brazil-China route earned $10,000 per day less than those on the Australia-China run. Owners previously had little incentive to “ballast” (sail empty) all the way to the Atlantic Basin. This left more ships competing for cargo in the Pacific.
In recent weeks, rates in the Pacific Basin have been weighed by too much ship capacity. Rates have fallen in the Atlantic Basin for a different reason: too few cargoes.
S&P Global Platts told FreightWaves, “In the Atlantic, Capesize markets have seen scant activities … [and] most participants said freight rates were yet to find the floor.”
What’s next for rates?
According to Ristic, “Pacific charterers seem well supplied for now and voyage rates are no longer paying a premium to those on C3 [Brazil-to-China route].”
“What happens next depends on Australian volumes,” he opined. “We’re seeing an uptick in the number of ships heading to the Atlantic, which will likely weigh rates there. But if Chinese demand remains strong and Australian shippers decide to ramp up output again, we could see another squeeze on available Pacific ships.”
According to Breakwave Advisors, “Turnarounds in freight rates are impossible to predict or time well. Yet if one uses last year as a blueprint, one should expect the spot market to bottom over the next couple of weeks and turn back up as we enter the month of August.”
