Fra Zerohedge:
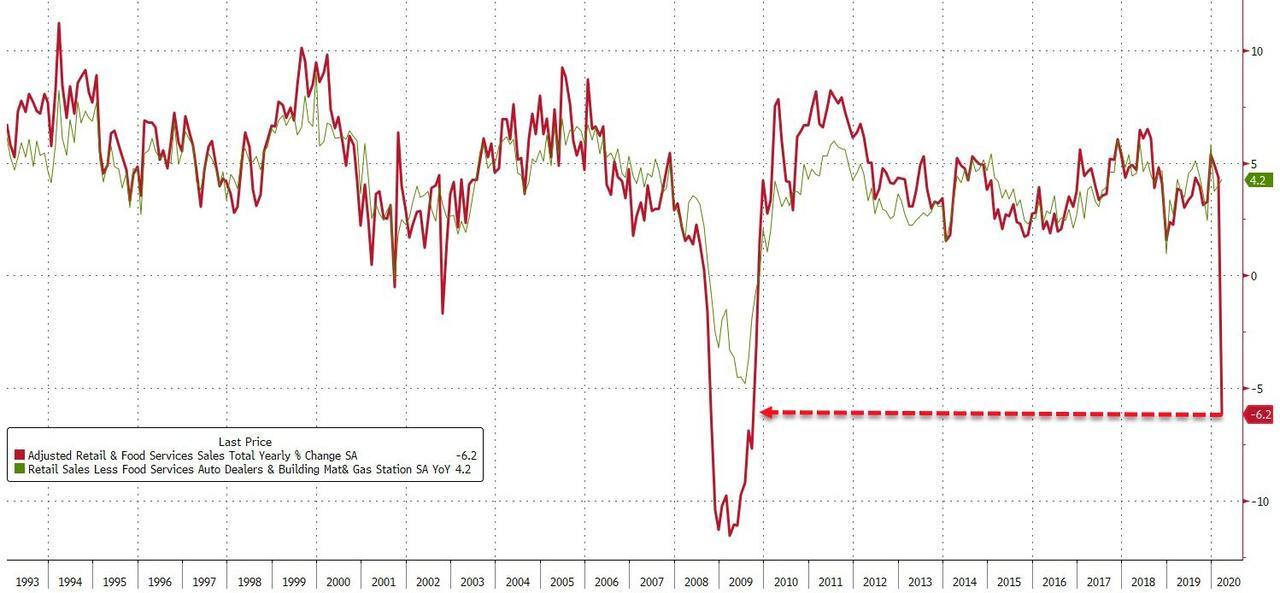
Last week’s retail sales print was – just like the rest of recent economic data – dismal, with the year-over-year drop of 6.2% the largest since September 2009.
Alas, it appears that the government data may have dramatically underrepresented the full severity of the recent plunge. As a reminder, the Census Bureau takes unadjusted numbers and smooths them through the X-14-Arima goalseekarator, which however has never before had to apply a Fourier transformation to an economy which overnight entered a hard stop. That’s why the unadjusted data is far more important to get a true sense of the severity of the current plunge. And since consumer spending accounts for 70% of US GDP, having an accurate read of just how far it has fallen is critical not only to gauge the change in GDP, but corporate profitability which as JPMorgan calculated previously, has a 7x beta to changes in GDP.
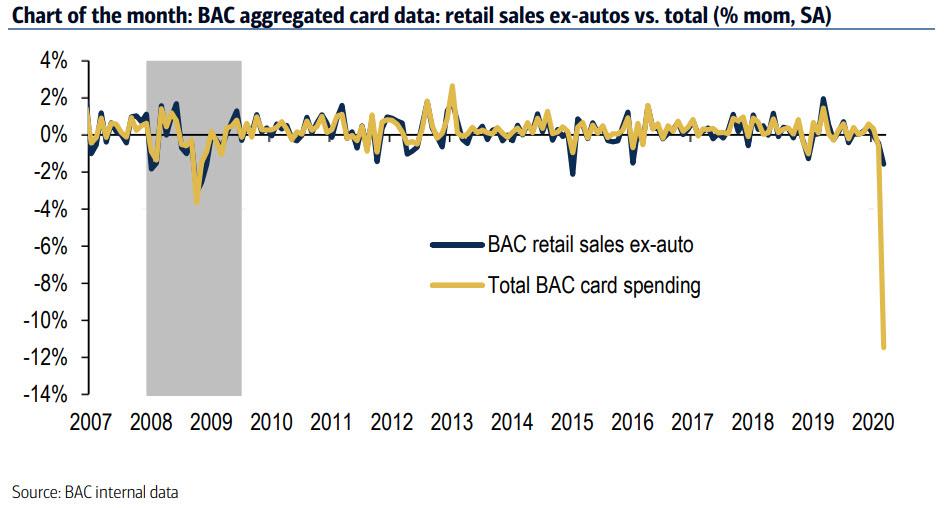
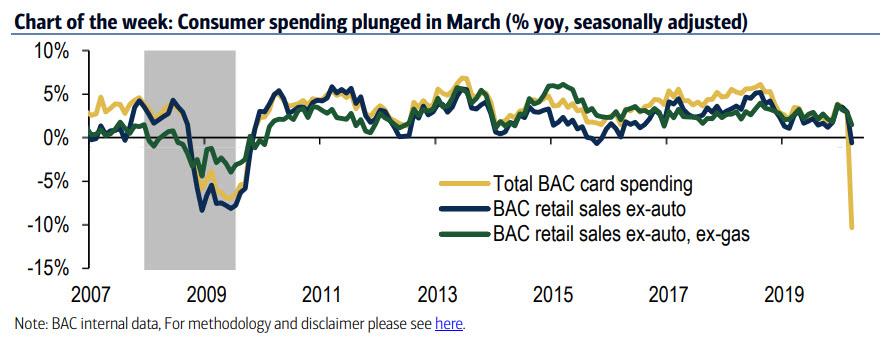
To do that, we used Bank of America’s credit and debit card data for the month of March. What it showed is that while the standard measure of spending – retail sales ex-autos – was down just 1.6% month-over-month (mom) seasonally adjusted, total card spending was down a severe 11.5% mom SA. The difference speaks to the composition of each measure as retail sales ex-autos exclude the hardest hit sectors from COVID-19 such as travel and other types of services.
And since the year over year drop was also greater than the depths of the 2008 financial crisis, expect not only March data to be far worse than initially reported, but April – when the entire economy was shut down for the full month – to be absolutely abysmal.
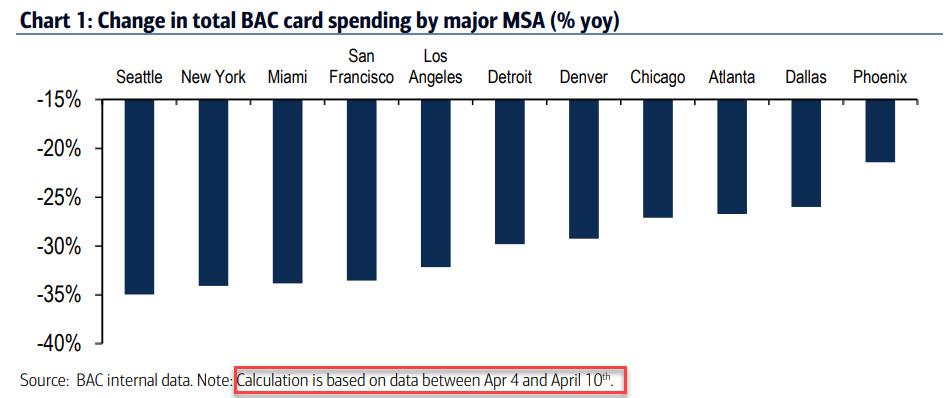
Looking ahead, BofA expects the weakness “to persist through April and become more apparent in the narrow measures as well.” And indeed, when examining the latest daily debit and credit card spending in the first week of April 10th, BofA finds that total card spending was down an average of 30% yoy.
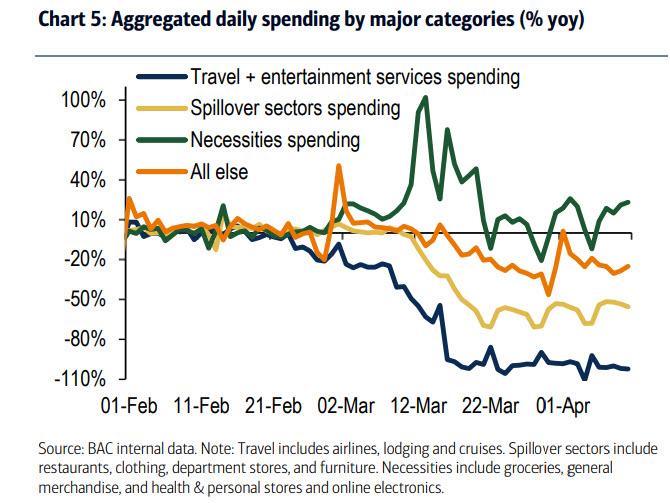
The continued drop took place despite a “meaningful improvement in online retail card spending, which was up 50% yoy in the 7-day period ending April 10th.” This partly reflects a shift to online ordering for food with online grocery store spending up 162% yoy and restaurant orders placed online up 85% yoy over the same 7-day period. Some more good news: online discretionary spending also improved, with further gains in online electronics as well as modest improvement in online clothing and department stores.
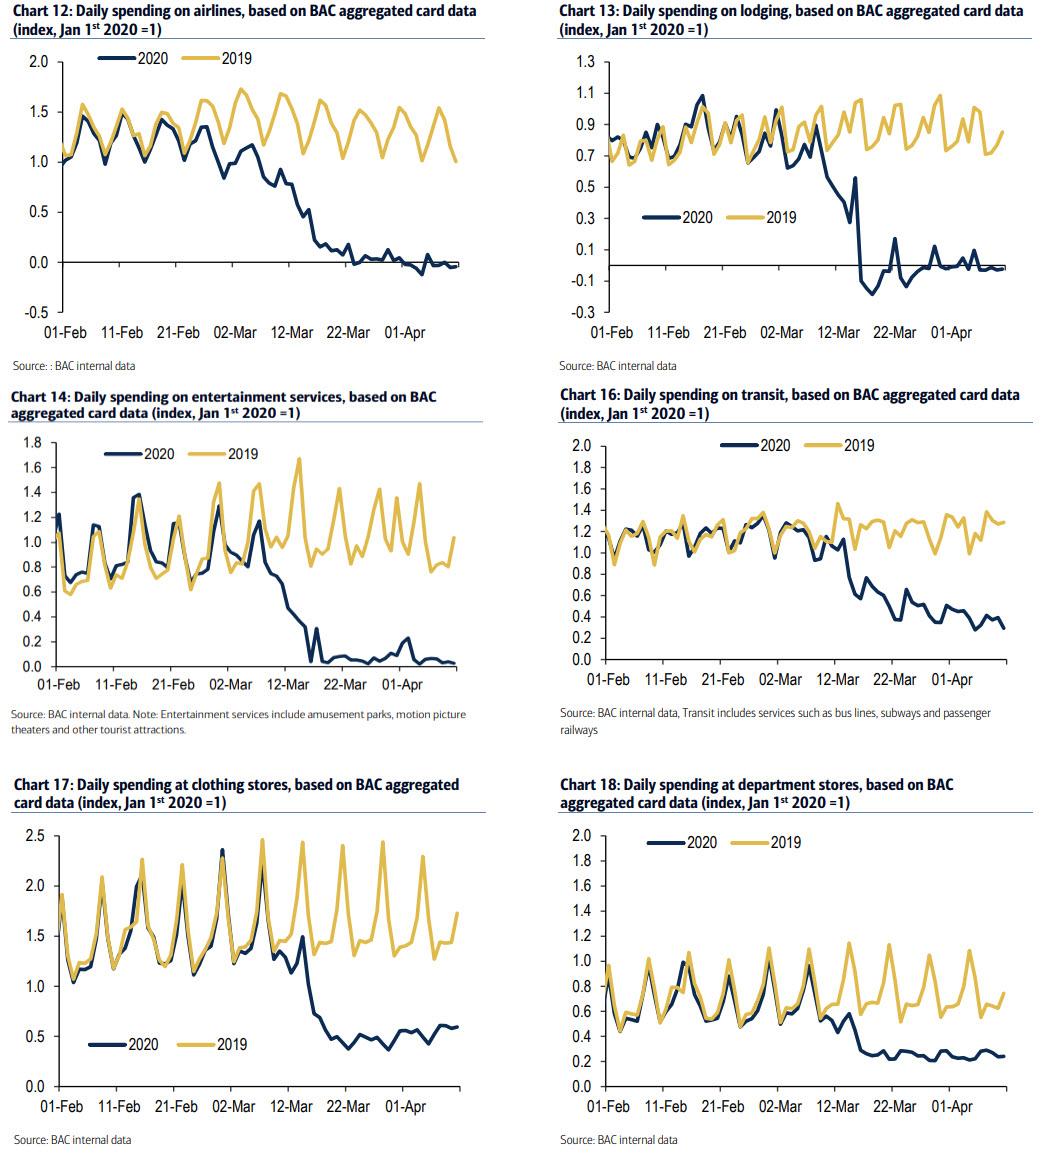
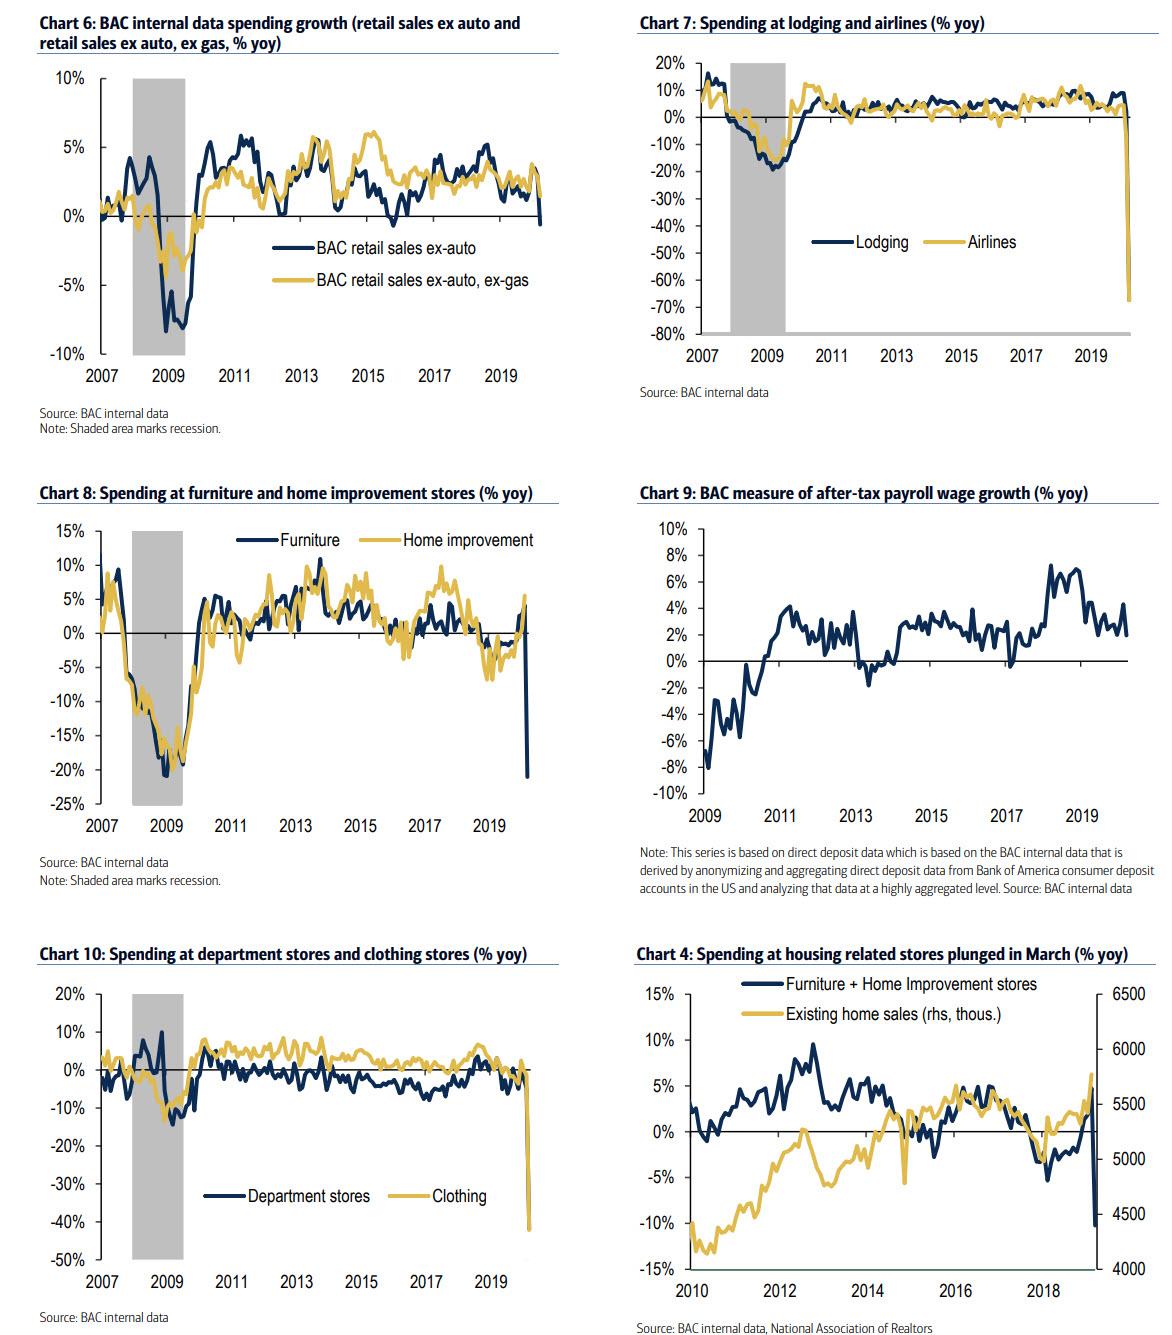
On the other side, a number of categories continue to show virtually no spending, including airlines, lodging and entertainment services.

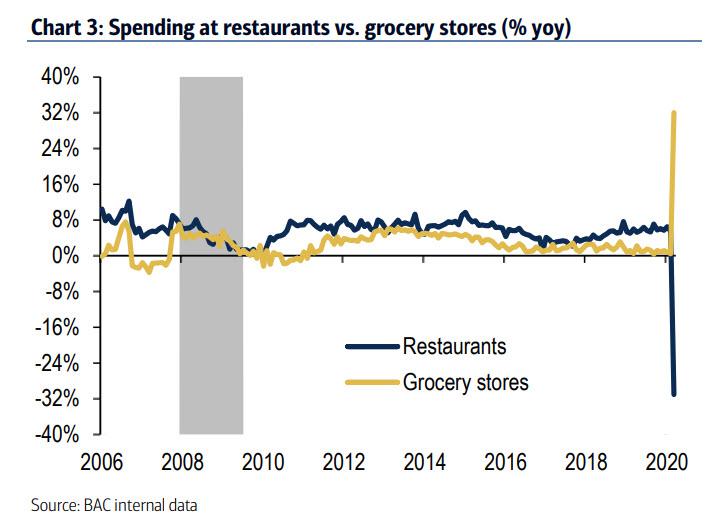
Restaurants and clothing stores have stabilized, with % yoy down around 50% and 60%, respectively. Even spending at grocery stores has cooled from a very strong March as people shelter at home.
There was a paradoxical silver lining in that if looking at just the GDP-defining control group (retail ex-autos, building materials, restaurants and gasoline), the aggregate actually increased in the month. This reflects the fact that core control nets out restaurants and gasoline which were both down sharply, and leaves a more narrow measure of spending where grocery store spending – which was up 31% mom SA – has a larger weight.
And speaking of paradoxical, the breakdown of spending by income group shows something even more strange: spending slowed down the most for the highest income group, to just 0.3% in March from 2.7% in February. This could reflect the fact that higher income households have a larger share in discretionary spending which saw the biggest drop. It would also mean that the economy could be hit even more severely than some of the latest fire GDP forecasts which expect as much as a 50% drop in GDP growth.

Below we present some more charts to show the dramatic transformation to consumer spending which the covidepression has triggered within the US economy, first for just the month of March…
… and then also for the first ten days of April.