
By Michael Lebowitz of 720 Global
Recently, Wall Street and the Financial Media have brought much attention to the flattening and possible inversion of the U.S. Treasury yield curve. Given the fact that an inversion of the 2s/10s Treasury yield curve has predicted every recession over the last forty years, it is no wonder that the topic grows in stature as the difference between the 2-year Treasury yield and the 10-year Treasury yield approaches zero. Unfortunately, much of the discussion on the yield curve seems to over-emphasize whether or not the slope of the curve will invert. Waiting on this arbitrary event may cause investors to miss a very important recession signal.
The Incentive to Lend
A friend approaches you and asks for a loan. You are presented two options, lend her money for two years at 2% annually or for ten years at the same 2% annual rate.
Later that day, another friend approaches you for a loan. This time you have the option of lending money for two years at 2% or for ten years at 6% annually.
For the lender/investor in both cases, we will ignore inflation risk and assume the two borrowers are in similar financial circumstances. Given the options, you likely answered that if you were forced to lend in example one, it would be only for two years as lending for ten years produced no additional financial incentive to compensate for the additional eight years of risk. Keep in mind most of us would not lend for two years either due to the low-interest rate.
In example two, you may have been incentivized by the higher ten-year interest rate the borrower was willing to pay you. In example one, the “yield curve” is flat at 2%. In example two it is considerably steeper as 10-year “yields” are 4% higher than 2-year yields.
As portrayed, when investors are faced with a flat or inverted yield curve, their incentive to lend for longer terms is greatly diminished. The opposite holds when the yield curve is steeper as in the second example. Taking this one step further, when the absolute level of yields is very low, the incentive to lend, irrespective of the slope of the curve, is also greatly diminished.
When lenders have no financial incentive to extend credit, economies dependent on ever-increasing amounts of credit tend to struggle.
Yield Curve Predictive History
The graph below plainly shows that when 2-year Treasury yields exceed 10-year Treasury yields, otherwise known as “a curve inversion,” a recession has always followed. Following the inflection point of the inversion, as circled, the curve steepens through a recession and for some time afterward.
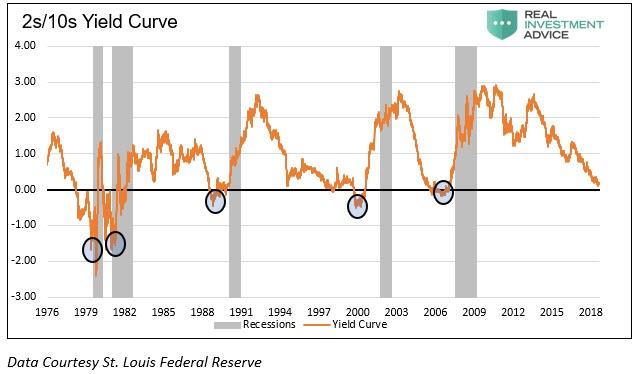
Given the curve is approaching the inversion point (black line), this compelling evidence is supposed to convince us that the odds of a recession are currently increasing but, and this is important, a recession is not a foregone conclusion yet. While a solid argument based on history, it rests on the theory that there will not be a recession unless 10-year yields drop below 2-year yields (black horizontal line in the graph).
There is another significant trend in the graph, which has gone largely unrecognized. The table below shows the lowest readings of the 2s/10s curve occurring before each of the last five recessions. It is the point of maximum curve inversion for each cycle.
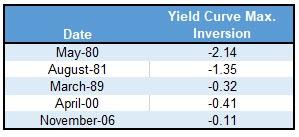
As shown, the magnitude of the greatest yield curve inversion has steadily declined in each of the past five pre-recession episodes.
Increasing Debt Burden and Tight Lending Conditions
The graph below compares total domestic Debt and GDP.
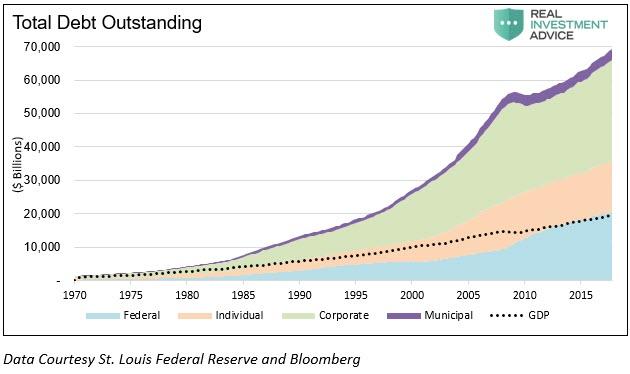
The graph highlights that debt is growing faster than GDP, with GDP representing our collective ability to service repay our debt. In this situation, it takes increasingly greater amounts of debt and lower interest rates to service the existing debt as well as generate new economic activity.
With this troubling dynamic in mind, think back to the two lending propositions we presented earlier. As the yield curve flattens and, by default, lenders are less likely to lend money and economic activity so dependent on that lending activity, slows.
If you accept that line of reasoning, then you must also agree that economies with larger debt burdens are more sensitive to a tightening of financial conditions. Taking it one step further, the amount of inversion required to generate a recession in such a scenario also declines. Might we now be at the point where inversion is not required, and a flat enough yield curve will hamper borrowing and stymie economic activity?
Summary
Based on history, one may deduce that if the curve were to steepen from this point, the odds of a recession decline. We strongly disagree. Given the incremental debt accumulation that has occurred as compared to the accumulation before those five prior episodes, financial conditions have more than likely already tightened enough to induce a recession. The recent steepening of the curve, which might be misinterpreted as a relief, is a flashing red signal that a recession is still very much possible.
For those of you that are stubborn and waiting on the curve to go to zero to sound the recession warnings, we share the graph below, courtesy of Crescat Capital LLC.
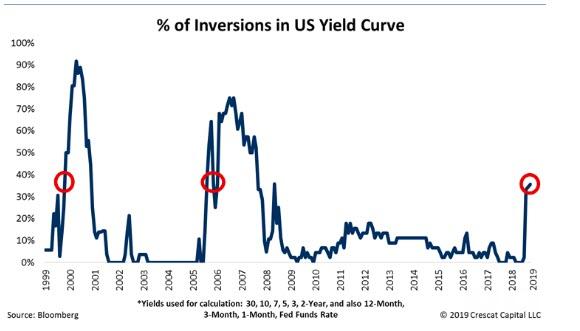
The graph looks at numerous yield curves and computes the percentage of them that were inverted at various points of time. Note that about 40% of curves are currently inverted. Have the collective curves already sounded the alarm, but everyone is too focused on a flat 2s/10s curve to hear it?
