

Fra Zerohedge/ BofA
Back in mid-December, when stocks were melting up furiously daily amid unprecedented retail euphoria, which would only get crazier and crazier until eventually it forced Citi to use a bigger chart two months later to capture the market’s retail euphoria…
.. we reported that Bank of America’s first proprietary sell signal since February 2020 was triggered:
According to BofA., equity “barbell” strategies all the rage while (the few remaining) bears note cash levels fall to 4.0%, triggering an FMS Cash Rule “sell signal”; The last time the sell signal was triggered was in February 2020 – everyone knows what happened next.
Fast forward three and a half months, and another wobble in tech stocks later, when yet another BofA sell signal has been triggered.
As BofA’s Savita Subramanian wrote last week overnight, Wall Street strategists continued to increase their recommended equity allocations in February. As a result, the bank’s Sell Side Indicator (SSI), which is the average recommended equity allocation by sell-side strategists, rose for a third month in a row to 59.4% from 59.2% (and 58.4% the month before that); it is now at a 10-year high and the closest to a contrarian “Sell” signal (<1ppt) since May 2007, after which the S&P 500 declined 7% in the subsequent 12 months… and 13% in the 12 month following “Sell”.
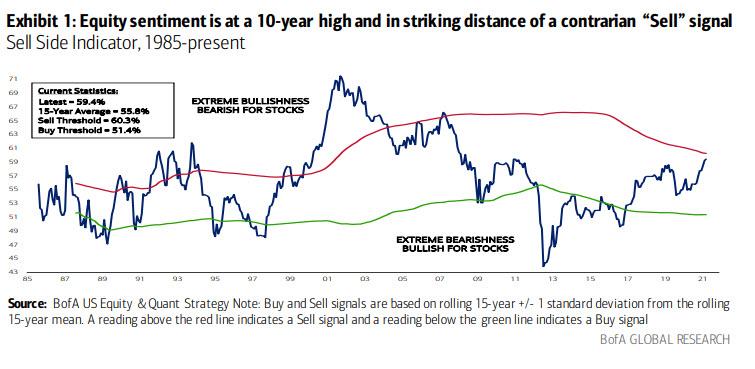
According to the BofA chief equity and quant strategist, increasingly euphoric sentiment is a key reason for the bank’s neutral outlook as the cyclical rebound, vaccine, stimulus, etc. is all priced into the market by now. Meanwhile, since last March, the avg. recommended equity allocation has risen by over 3x the typical rate: 450bp vs 138bp in 12m following prior bear markets.
As Subramanian concludes, “we’ve found Wall Street’s bullishness to be a reliable contrarian indicator” although she hedges by noting that while the indicator is still fractions away from a full “Sell” signal, it is less predictable when it is in “Neutral” compared to extreme “Buy” or “Sell” levels. As such, when the indicator has been at or below current levels, subsequent 12m returns have historically been positive 89% of the time. In other words, the market may fall… or rise.
Still, she concludes that “while encouraging, the current level is forecasting 12m returns of just 6%, a much weaker outlook compared to an average 12m forecast of 14% since the end of the Global Financial Crisis.”