Uddrag fra Goldman Sachs/ zerohedge
Stock market concentration has increased dramatically and has taken three broad forms:
- the rise in the share of the US equity market in the world,
- the rise in the share of the technology sector,
- and the rise in the dominance of the biggest companies in most regions.
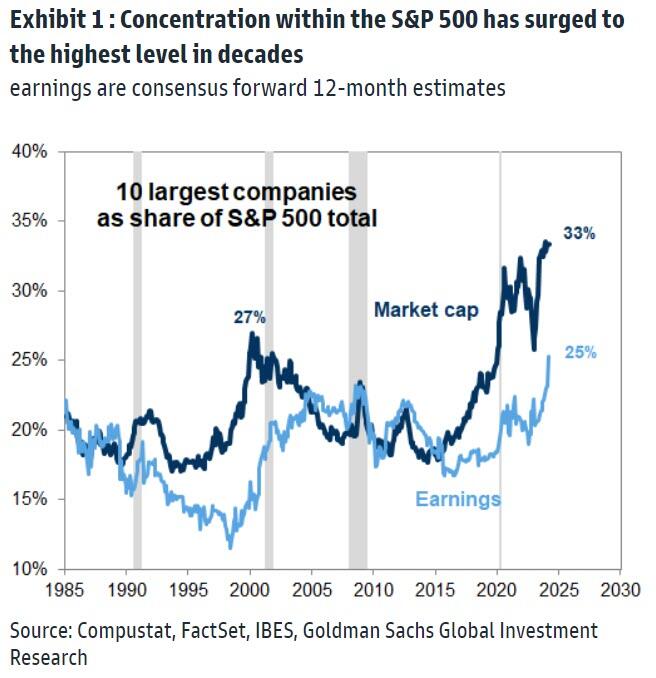
In fact, as Goldman Sachs highlighted in a recent note, concentration within the US equity market has surged to a multi-decade high.
The 10 largest US stocks now account for 33% of S&P 500 market cap and 25% of S&P 500 earnings.
The 10 largest stocks – just 2% of S&P 500 companies – have accounted for more than a third of the S&P 500 return in each of these five years. Even including the 36% decline in 2022, an investor who only owned the 10 largest S&P 500 stocks in each of the last five years would have enjoyed a compound annualized return of 20%.
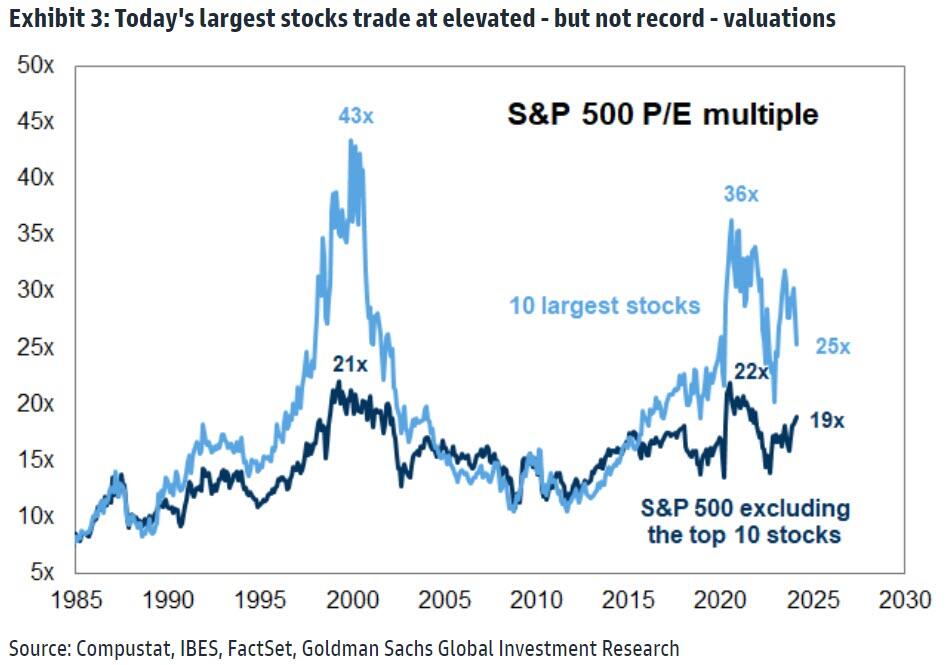
In contrast with record concentration, the valuations of the largest stocks remain well below previous highs. Today’s 10 largest stocks trade at a collective forward P/E multiple of 25x today, substantially below the peak valuations carried by the largest stocks in 2000, 2020, or even in the middle of 2023.
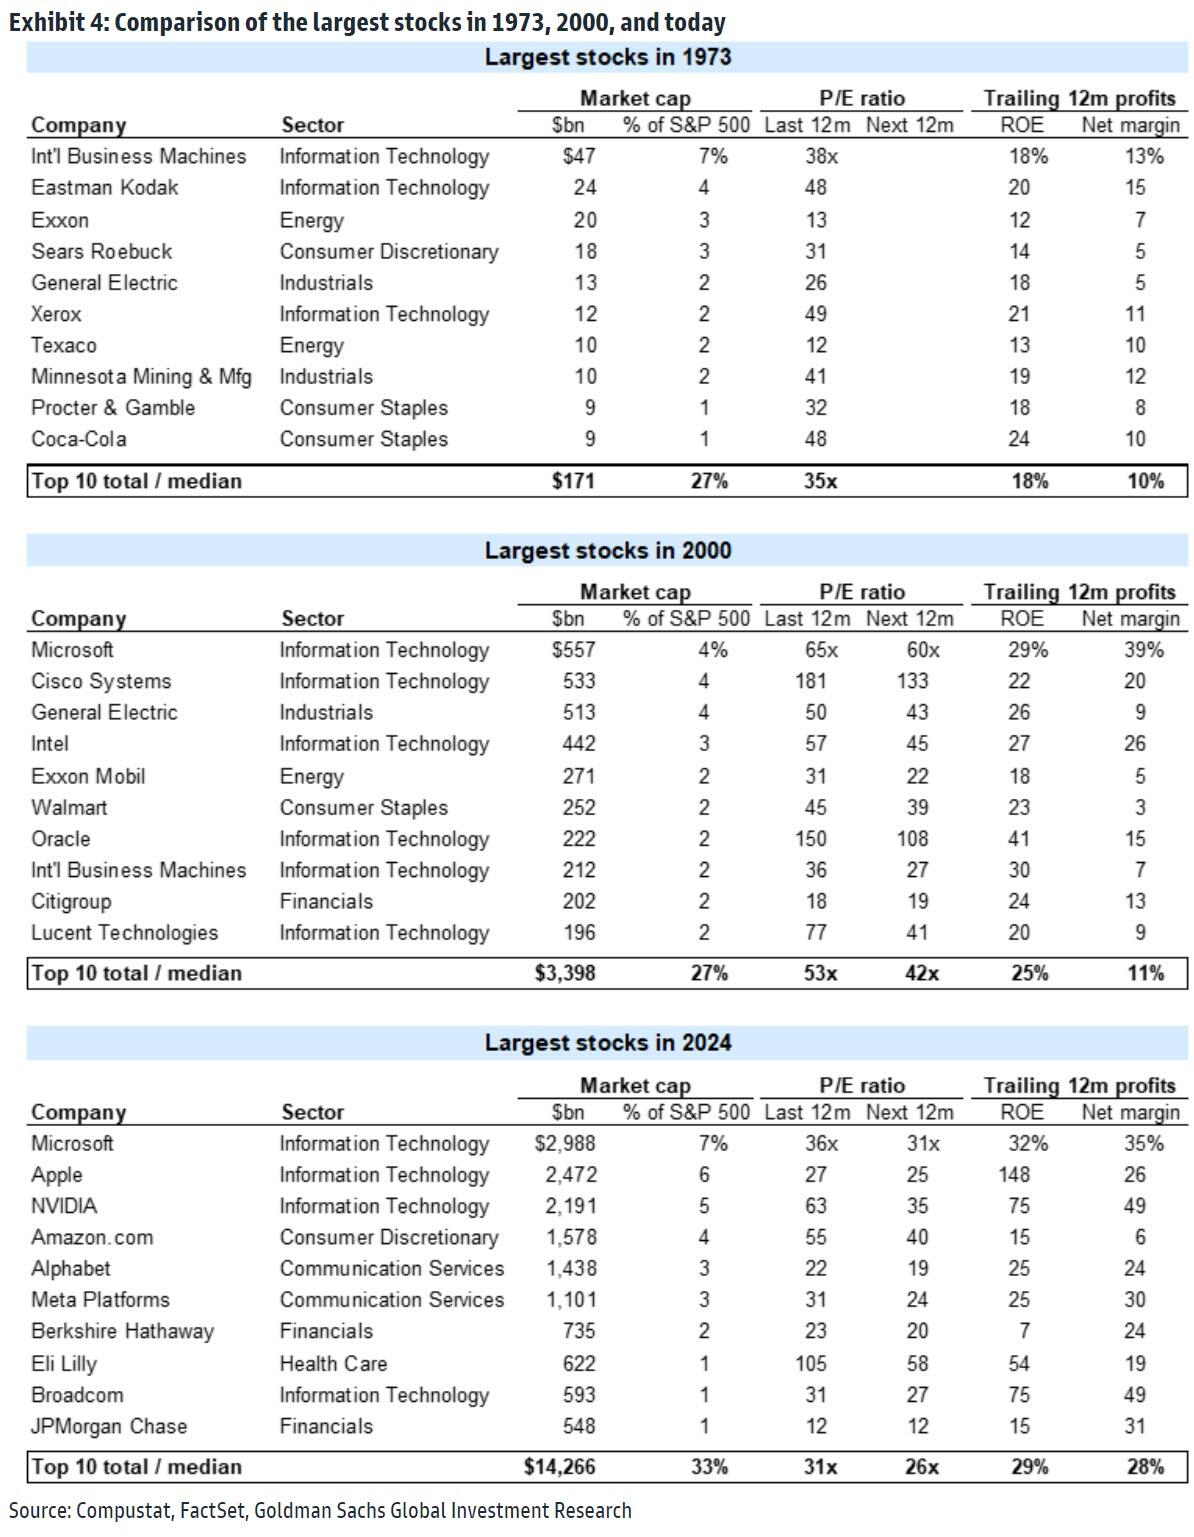
Under the hood, the following table shows the valuations of the largest stocks today are similar to those carried by the largest stocks in 1973 (the peak of the ‘nifty fifty’), but compared with the peak of the Tech Bubble, the largest stocks today carry much lower multiples.
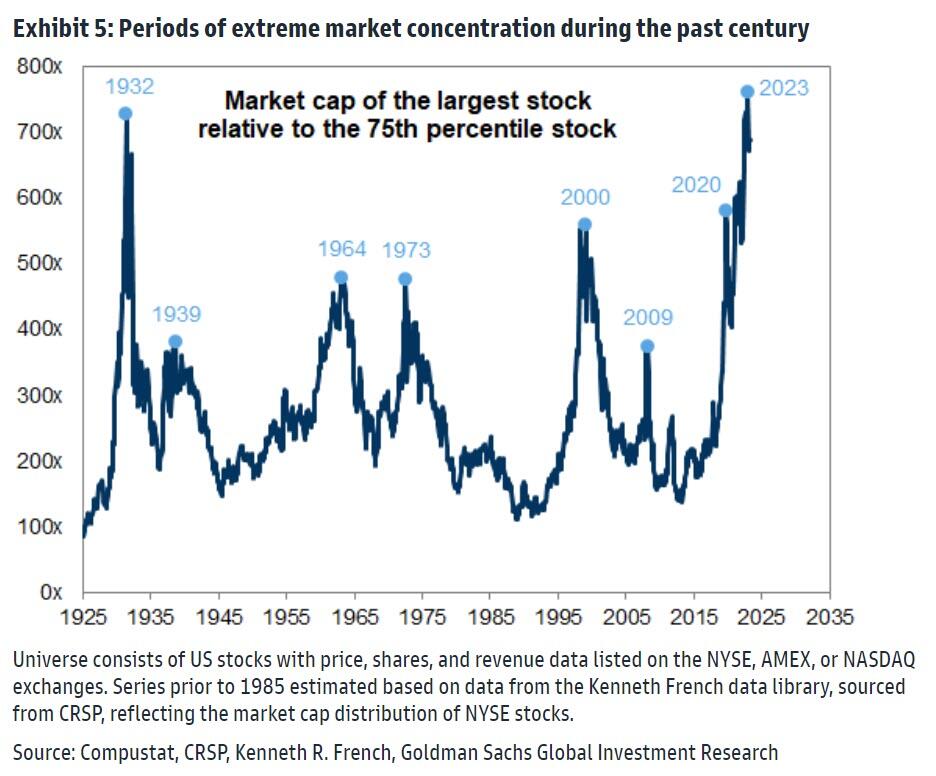
Although investors have focused on the comparison between today and the markets in 1973 and 2000, there have been several other examples of extreme equity market concentration during the past century.
To expand the sample of comparable episodes, we estimate a long-term series of equity market concentration by supplementing our bottom-up equity database with data underlying the factor work of Eugene Fama and Kenneth French.
This measure, shown below in Exhibit 5, correlates well during the past 40 years with the share of S&P 500 market cap concentrated in the 10 largest stocks charted above in Exhibit 1.
It shows seven other periods of extreme concentration during the past century, including 1973 and 2000 as well as 1932, 1939, 1964, 2009, and 2020.
While the episodes in 1973 and 2000 preceded large market downturns, equities continued to rally following most other instances of extreme concentration.
Today’s combination of elevated market concentration and recent Momentum outperformance has furthered investor concern that a sharp drop in the largest stocks will lead to a market downturn.
But history shows that “catch up” episodes are much more common than “catch down” experiences.
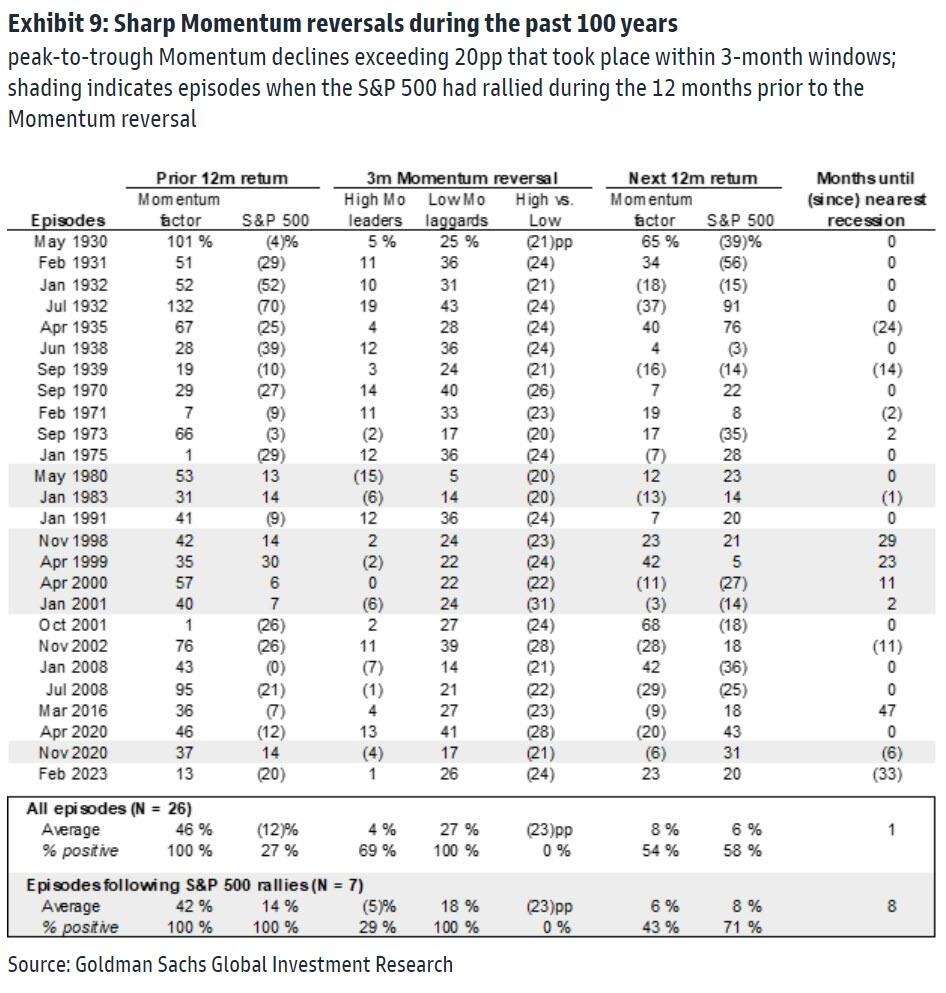
The table below shows 26 peak-to-trough Momentum reversals since 1930.