

Få fri adgang til alle lukkede artikler på ugebrev.dk hele sommerferien:
Tilmeld dig tre udgaver gratis af aktieanalysepublikationen ØU Formue, der udkommer igen til august
Uddrag fra Bank of America og Goldman:
In the report, Hartnett first offers his congratulations to the S&P 500 which he says is “on the cusp of 7th great breakout since 1990” then quickly cautions that this latest breakout, as one would expect in a world dominated entirely by the Mag7, has had the smallest “breakout stock” participation, meaning that it is literally determined by a handful of stock. How many? Well, there are just 22 S&P stocks currently at all-time highs…. vs 67 in the January 24 breakout, 54 in August 2020, 97 in March 2013, 82 in May 2007, 66 in November 1998, and 51 in Feb 1991.

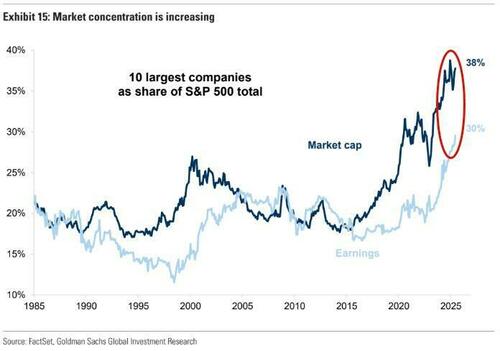
Tech back driving US equity bus, and has been the case for the past year, it remains the narrowest bull market in history… something which Goldman’s Peter Oppenheimer discussed at length in his latest chartbook, where he showed that the top 10 companies now account for a record 38% of market cap and a record 30% of profits (see “Goldman Reignites Concentration Risk Concerns Amid Bad Breadth & Dollar Divergence“).
No wonder then that Peter’s colleague David Kostin, who is Goldman’s head of US equity strategy, just showed in his latest Weekly Kickstart report that the S&P market breadth – defined not by the number of breakout all time highs but by more conventional means (i.e., index vs constituent divergence) – is about to hit new all time lows.
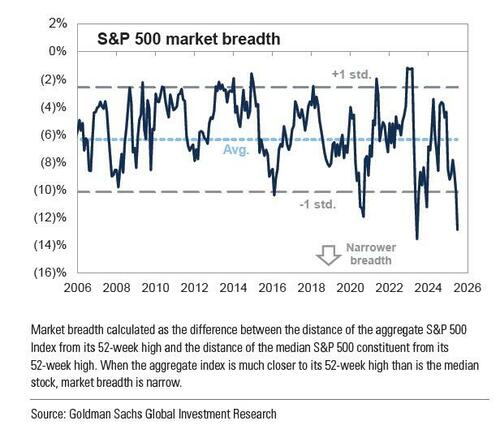
As Kostin puts it, “the S&P 500 rally has been defined by extremely narrow breadth that ranks as one of the most concentrated surges experienced during the past few decades.”
In their EOD wrap, Goldman’s trading desk also harped on the unprecedented bad breadth of this market (full note available to pro subscribers), while also noting that as SPX and NDX have both retraced to the highs, it is worth highlighting the Russell 2k is still trading ~11% below its high print.”

Kostin’s conclusion: “the S&P 500 will return +5% over the next 12 months to reach 6500.” Which is rather downbeat considering the current meltup has pushed the S&P almost 5% higher in just the past 2 weeks, and also considering that we are now entering the strongest month for the S&P historically, as July – which hasn’t been red in the past decade – brings an average return of 1.67% looking back to 1928 and double that in the past decade (and in true patriotic spirit, July 3rd has brought the 2nd best single day return for the S&P historically at 48bps, only beat by October 20th at 57 bps).

On a historical basis, this is the best two-week period of the year, which is why Goldman’s flow gurus said earlier that they “see the peak around the July 17th date followed by a leg lower” although they concede that July’s “risk events” may bring this sooner