Uddrag fra Bank of America:
BofA’s Global Equity Derivatives Research desk take a detailed look under the hood at what happened in 2024 and what lessons we can learn – and apply – in 2025…
1. Think 2024 was a good year? It may only be the beginning
2. 2024 looked more like ‘96/’97 than ‘98/’99
3. In a bubble, leadership can last longer than you can stay underweight
4. But momentum + valuation already too rich to avoid a bust
5. VIX proved markets remain fragile & shock is overdue
6. Aug24 says buy dips & lock in vol spikes; use smarter ‘SkeU’ delta in ’25
7. Rising debt + sticky inflation = bond vigilantes biggest visible macro tail risk
8. Fragility + faster reactions + valuations mean no 2017 vol repeat
9. Trump win ignited tariff risk; EU Dollar darlings = next trade targets?
10. EU cheap & unloved – don’t be caught short; Fewer crowds = less vol pain
11. China outperformance vs Japan in ‘24 could continue if US rates fall
12. VIX option intel shows positioning risks linger
13. EZ Bank divs beat NDX for half of the past year; hedge for ‘25 being different
14. YenMageddon says watch USDJPY driven Nikkei instability in ‘25
Here are some selected details from the report…
1. Think 2024 was a good year? It may only be the beginning…
What: US equity markets continued their upward march in 2024 without many signs of slowing down, as the S&P notched its second consecutive year of 20%+ gains led by megacap tech dominance (again).
The prospect of deregulation and tax cuts from the incoming Trump administration have only added further fuel to the equity boom postelection, which could continue going into 2025.
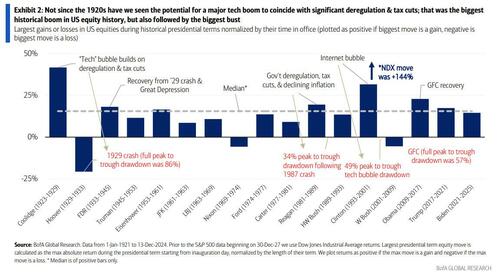
Why it matters: Laissez-faire economics, tax cuts and deregulation have historically driven rapid asset price inflation (e.g., Coolidge, Reagan presidencies; see Exhibit 2), as have technological booms (e.g., automobiles, radios in the 1920s, internet in the 1990s).
2025 presents the rare case of having a collision of both, as the Trump administration’s policy shift meets the AI revolution. Such a combination is one which we may not have seen since the Roaring ‘20s and amplifies right tail risks going into 2025, perhaps more so than many expect.
3. In a bubble, leadership can last longer than you can stay underweight
What: US small caps jumped higher after the US election, yet another sharp but shortlived small cap rally that followed a large period of underperformance. Again this time, after the brief episode, large caps and especially Tech recovered the baton and have resumed their leadership. While some are calling and positioning for a rotation away from 2024 leaders, factors like the AI boom and high rates may help US large-cap Tech continue to outperform, an underpriced right tail risk, in our view.
Why it matters: Many investors either aren’t able to get up to market weight on large cap Tech or are nervous about stretched sentiment and valuations in the space. But not owning enough US stocks or large-cap stocks or Tech stocks has been a painful stance for many years, and we think it’s still a major risk in 2025.
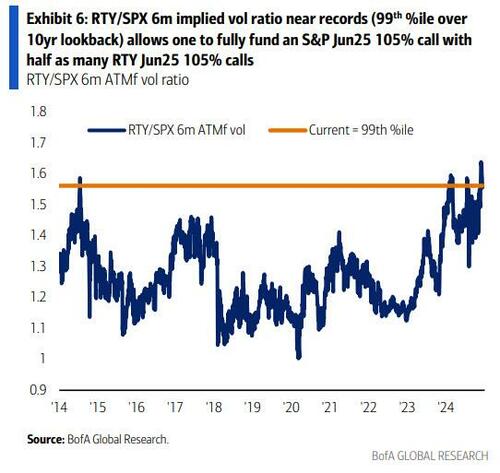
Fortunately, one can take advantage of record RTY vol vs SPX vol to hedge the risk of lagging benchmarks over the next 6 months, either through outperformance calls contingent on RTY up at expiry or by funding long SPX calls with short RTY calls.
The outperformance call contingent on RTY up offers limited risks at a large discount. The structure we suggested in our 2025 Year Ahead costs just 18% as much as the vanilla outperf., and would have paid off 67% as often in the last 10yrs.
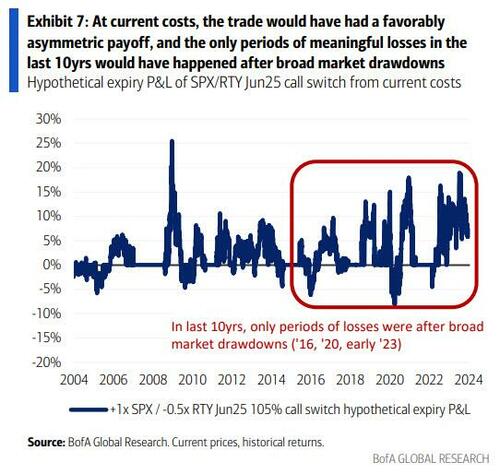
The call vs. call stands to lose more if small caps rally much more than large caps, but it doesn’t need small caps up by June to benefit if large caps continue to lead. For example, one can buy 1x SPX Jun25 105% calls and sell 0.5x RTY Jun25 105% calls for zero-cost. RTY/SPX 6m vol ratio in the 99th %ile (Exhibit 6) allows one to fully fund an S&P Jun25 105% call with half as many RTY Jun25 105% calls.
Assuming current costs, the trade would have paid off much more frequently than it would have lost money, and the only periods of meaningful losses in the last 10yrs happened after broad market drawdowns (Exhibit 7), a different environment than today.
4. But momentum & valuation already too rich to avoid an eventual bust
What: The S&P is on pace to notch back-to-back 20%+ years, and upside momentum looks to remain strong as we close out 2024. However, with the index’s forward P/E sitting above 25 as of the time this was written, valuations are historically stretched going into the new year.
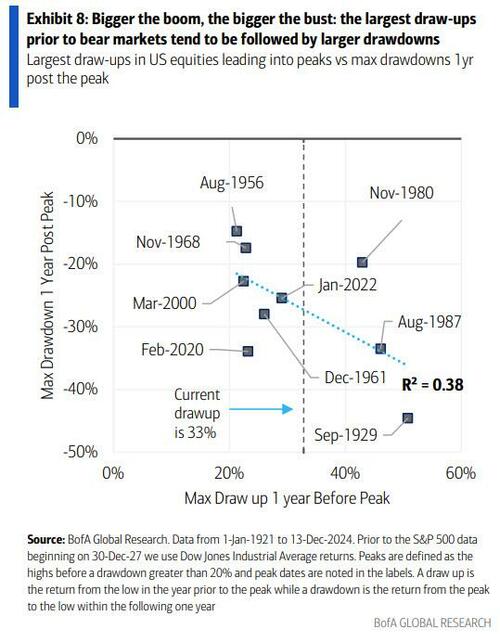
Why it matters: While de-regulation or technological innovations have historically supercharged equity booms, such booms have also always been followed by busts (see Exhibit 2). In fact, large US equity draw-ups that preceded bear markets tended to be followed by the largest drawdowns in the year following peak (Exhibit 8).
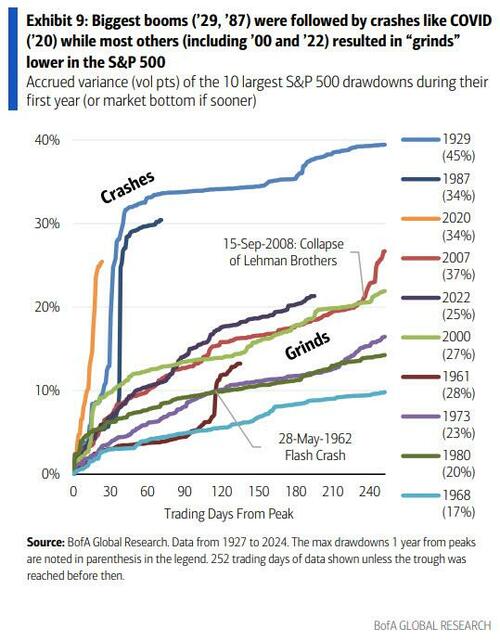
With the current S&P draw-up already exceeding >30% and valuations approaching stretched levels, history suggests it’s too late to avoid a bust at this point. Moreover, with such drawdowns showing both crash (e.g., ’29 & ’87 crashes) & grind-lower (e.g., ’00 internet bubble unwind) signatures as illustrated in Exhibit 9, planning for either eventuality while hedging is key, in our view.
5. VIX proved markets remain fragile & shock is overdue
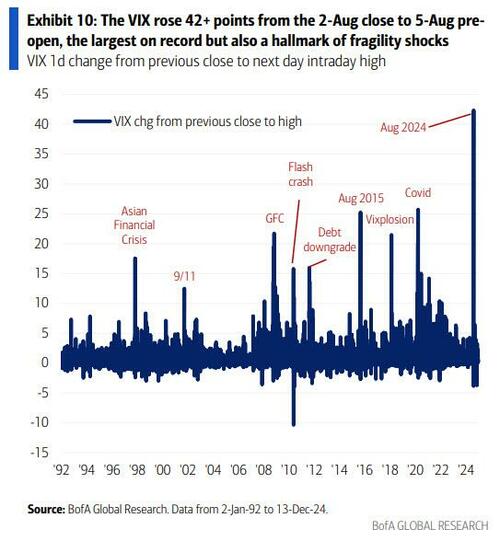
What: The 5-Aug-24 VIX shock – a 42-point spike pre-open on a mere -4.4% drawdown in S&P futures – was the largest in its 34-year history (Exhibit 10).
Our analysis showed that Aug 5th was not driven by popular culprits like 0DTEs, quant funds, or mass unwinds of customer short vol trades. Rather, it was a liquidity crisis in the world’s central insurance markets for risk assets (e.g., S&P options and VIX derivatives), exacerbated by dealer positioning in VIX options.
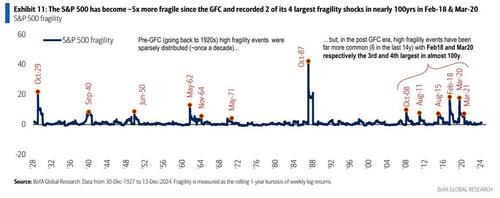
Why it matters: Markets have become structurally more fragile in the last several years, experiencing longer periods of calm followed by fatter tails (i.e., more leptokurtic return distributions). As we first put forward in our 2016 Outlook titled Fragility is the new volatility, this has been driven by a feedback loop of investors crowding into a limited set of momentum trades and then facing a dearth of trading liquidity upon exit (when liquidity is needed most). The August 5th VIX shock was a stark reminder that the underpinnings of market fragility remain alive and well. And with the S&P recording a fragility shock every 2-4 years, but not since the COVID era (Exhibit 11), a market-wide event may be overdue and is a key left-tail risk for 2025.


