Uddrag fra Goldman Sachs, Morgan Stanley og Zerohedge //
Q2 kommer lige efter US børslukketid kl. 22 dansk tid, analytikerne forventer 0,64 USD per aktie
It may still be the most important stock in the world but unlike last quarter and the quarter before, positioning does not feel as crowded at ~$125 today as it was the last time it was here in June, and according to Goldman trader John Flood (full note here), positioning this time is a 8.5 out of 10 compared to 9+ into prior prints. So, ever so slightly less concentrated than it has been over the past year, even if Jensen got to a sign a tit for the first time ever.
JPMorgan is not far off and in its NVDA earnings preview (available to pro subs in the usual place), JPM tech specialist Josh Meyers writes that Positioning is 8 out of 10.
Next, Meyers writes that “even before last month’s Blackwell panic, investors I speak with were already looking to diversify their AI holdings a bit; but still nobody seemed keen to bet against the name, on a view that NVDA remains extremely well-positioned and still have room to surprise (reference our bars that – though widely dispersed – show quite high expectations).”
Speaking of expectations, JPM has the following bogeys:
- Q2 Revenue: $29.85BN vs. $27.44~28.56b guide, and $28.6b consensus
- Data-Center revenue $25.52b (v. $22.6b last Q),
- Gross Margin 76.2% (v. 75%-75% guide),
- EPS $0.69 (v. $0.64 cons);
Guidance
- Q3 Revenue $32.95BN vs $31.41BN cons.
- FY 25 & FY26 Revenue $125.7BN and $186.6BN, vs $120.3BN & $166.18BN cons.
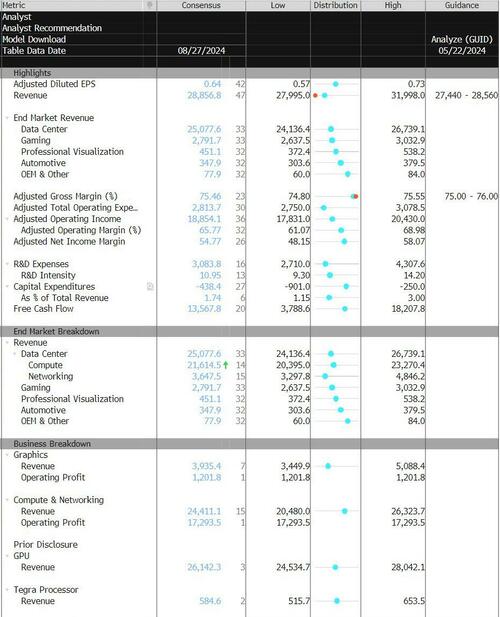
FWIW, here is the consensus breakdown.
In terms of logistics, the numbers typically hit at ~4:20pm ET followed by a conf call at 5pm ET (guidance in PR, but it’s all about what Jensen says on call).
On the bearish side, the JPM trader cautions that notwithstanding bigger-picture “capacity” concerns (CSP capex, model optimization, etc.), the one concern he hears most often is that we see a replay of 2H23, where the name trades sideways for an extended period. Countering that, JPM’s revenue whipser numer is $1.2BN revenue beat versus consensus, which Meyers says “is hopefully enough.”
And perhaps it will be, but the options market isn’t taking chances, and the implied move after earnings is a staggering 9.4%, or roughly $300 billion in either direction, although looking at recent history we find that the stock has finished down -2% to up +25% on the day after earnings on 9 straight prints (aka a very positive skew lately).
For those looking at some more “fundamental” detail, last week Goldman sellside researcher Toshiya previewed the print as follows:
- potential impacts of Blackwell timing, more supportive valuation (e.g. only a ~45% premium vs 3yr avg 151% premium)
- upside to earnings (GS is at $4.16 in CY25)
- Ongoing demand trends (GS believes CSP + Enterprise demand remains strong).
As a point of reference, the recent quarterly rhythm from NVDA the last few quarters has been a ~$1.5bn +/- topline beat on the quarter (as noted above, cons is $28.8bn in July quarterly revenues) with Nvidia guiding out quarter revenues up ~$2bn q/q in the out quarter (there is still plenty of debate on expects and/or how Blackwell timing shapes anything).
As an aside, here are some additional thoughts from JPM’s head of market intel, Andrew Tyler on what the risks are from here: NVDA, Positioning, Seasonality, and the US Election.
- (i) NVDA – discussed above
- (ii) Positioning – it does not appear that we have re-grossed to level seen before the downturn from mid-July to early-Aug and across the Street it appears that aggregate TMT positioning is UW the sector which may mean that the risk/reward from NVDA is skewed to the upside.
- (iii) Seasonality – this century, September has been the worst month of the year averaging -1.7% return (54% hit rate) followed by Q4 being the best time of the year averaging +4.2% (79% hit rate) but if you look at only the last five years, the SPX averages -4.2% (80% hit rate) and Q4 averages +9.8% (100% hit rate). 2024 has not followed 5-year nor 10-year seasonal trends with each month ex-January delivering either a directional or magnitude surprise;
- (iv) US Election – election years tend to extend the negative September seasonality into October due to policy uncertainty. With both candidates known to markets, it is possible that this effect is muted this year and if the polls/betting markets support either a Blue Wave or Red Wave then look for markets to pre-trade this but would think it wise to withhold until after the Sep 10 Presidential Debate and subsequent polling. Our team will have more details on the election in early September but do let us know if there topics you would like to see addressed.
- (v) Geopolitics – the situations in both the Middle East and Ukraine have been largely ignored by Equity markets but keep an eye on events that draw either the US or Turkey (NATO) into either conflict. Bullish commodity bets may be the most prudent hedges.
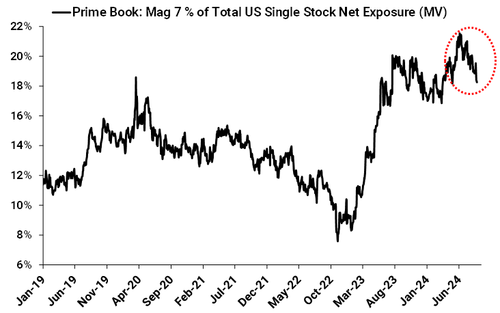
Before we go, Goldman’s John Flood shows two “noteworthy” charts from the latest Goldman Prime Brokerage report into the print tomorrow night. As a result of the drop in hedge fund exposure into Mag 7, Flood thinks that now is the cleanest set up to buy Mag 7 he has seen since early 2023. As shown below, Mag 7 currently makes up 18.2% of overall US Single Stock net exposure (a modest drop compared to the 20.5% at the end of June), ranking in the 30th percentile vs. the past year.
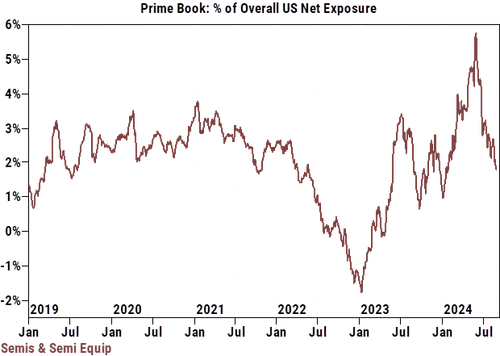
Add to that overall net allocation in Semis and Semi Equip, which is on track to be the most net sold subsector in Goldman’s book in August (driven by both long and short sales). The group now makes up 1.5% of Overall US Net Exposure on our Prime book (compared to 3% at the end of June and 5.8% end of May), ranking in the 13th percentile vs. the past year….


