Uddrag fra Goldman, SocGen og Zerohedge
we are taking a closer look what implications the preliminary election results have for US stocks in general, and which are the best Trump Trades in particular. In a comprehensive report from Goldman’s David Kostin, the strategist writes that investors and corporate executives will now focus on four issues relating to the US equity market:
- Post-election path of the S&P 500 index;
- Equity investor positioning;
- Rotations within the market, including those relating to trade and tax policy; and
- The outlook for corporate M&A and IPO activity.
Let’s take a closer look at each of these:
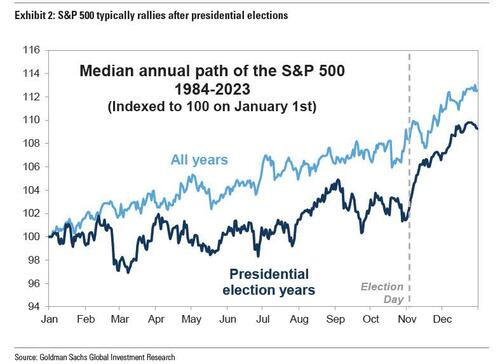
1. Post-Election Rally: A key driver for stocks in the near term will be the reduction in political uncertainty, a dynamic that typically drives strong year-end returns in Presidential election years. The S&P 500 index has historically generated a median return of 4% between Election Day in November and calendar year-end (Exhibit 2).
If repeated this year, that return would equate to an S&P 500 level of roughly 6015 at the end of 2024 and reflect a forward P/E multiple of 22x (22.4x using top-down 2025 EPS estimate of $268 and 21.7x consensus bottom-up estimate of $277). Along with the resolution of election uncertainty, resilient recent economic growth data and continued Fed rate cuts support the healthy near-term outlook for US stocks.
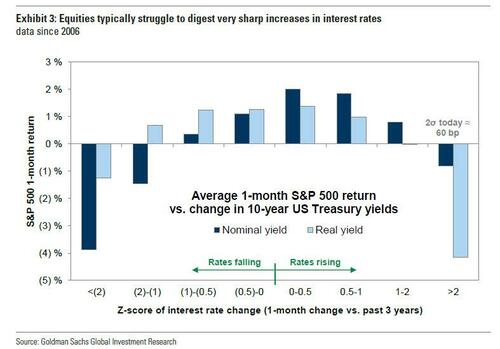
However there is a risk: further sharp increases in 10-year Treasury yields would limit the magnitude of any potential rally in stock prices. In mid-September – the day of the Fed’s first rate cut in years – Treasury yields reached a YTD low of 3.62% before climbing by 80 bp to the current level of 4.42%. All-else equal, a backup in rates of that size would typically be accompanied by a decline in equity prices according to Goldman. Historically, the speed limit for stocks has been a 2 standard deviation increase in 10-year yields, a pace that currently equates to about 60 bp in a month.
Instead, the S&P 500 index rose by nearly 3% concurrent with the jump in bond yields. Equities have digested this move because it has been primarily driven by better economic data. Goldman’s Economics team forecasts the Fed will cut the funds rate by 25 bp (to 4.5%-4.75%) on Thursday and reduce the policy rate by another quarter-point at the December 18th meeting, which should further ease financial conditions but also add to concerns the Fed is launching another major inflation wave which will further steepen the yield curve.
Finally, a historical anecdote: President Trump’s election to a non-consecutive second-term (45th and 47th Presidencies) is only the second time in US history that this situation has occurred; the only precedent is Grover Cleveland (22nd and 24th President). During Cleveland’s first term, the US equity market returned 43%. However, Cleveland’s second term started with the Panic of 1893 and an equity drawdown of 27% and the four-year total return equaled -4%. The S&P 500 index posted a total return of 83% during President Trump’s first term in office.
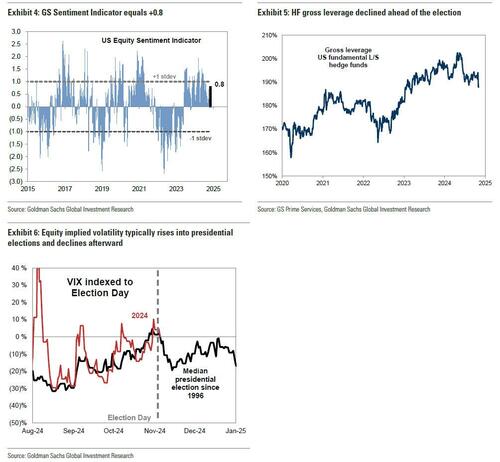
2. Equity Investor Positioning: Recent data suggest that investors reduced equity market exposure heading into the election. Goldman’s US equity Sentiment Indicator measures stock positioning across retail, institutional, and foreign investors, and suggests that collectively they are only modestly above their 12-month trend (Exhibit 4). While investor equity positions are not low, Goldman Sachs Prime Services data discussed last weekend indicated that hedge funds recently reduced both net and gross leverage in recent weeks ahead of the election (Exhibit 5). Similarly, the increase in implied volatility in recent weeks has matched the historical pattern ahead of elections, likely reflecting hedging activity (Exhibit 6). As political uncertainty declines and investor positioning normalizes, an increase in length should support the typical pattern of S&P 500 appreciation following presidential elections.
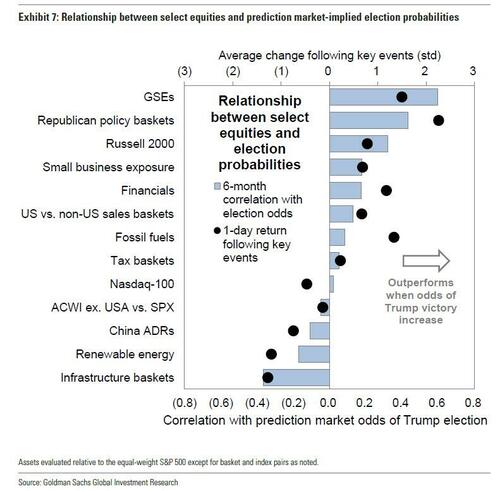
3. Rotation Within The Equity Market: The election results will have a meaningful near-term impact on intra-market rotations. A variety of equity industries and baskets have been correlated with prediction markets in recent months, reflecting investor perception of how post-election policy outcomes could affect fundamental outlooks. While Inauguration Day and any subsequent policy changes are still months away, these recent relationships suggest themes including small-caps and Financials will outperform and renewable energy stocks will lag as the market moves from pricing roughly 55% odds of a Trump victory to fully pricing that outcome.
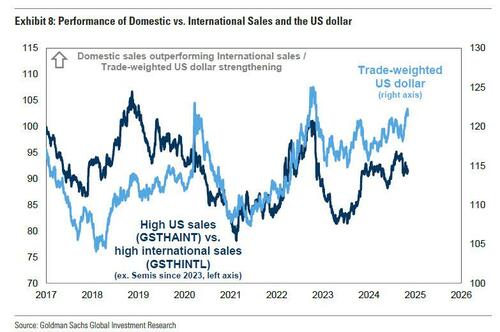
Goldman’s recent investor discussions have focused on trade policy, and the fact that tariffs may be implemented without additional legislation. As a result, the recent performance of stocks with domestic US revenues and supply chains relative to international-facing firms has been modestly correlated with prediction market odds of a Trump victory. Goldman expects Trump will impose tariffs on imports from China that average an additional 20 percentage points.
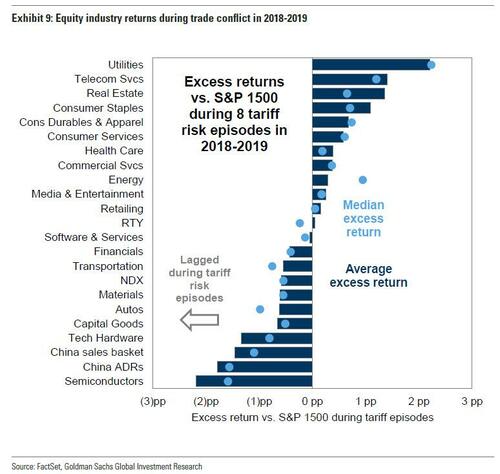
Likewise, during the trade conflict experience in 2018-2019, domestic-facing and defensive industries generally outperformed cyclical industries with elevated international business exposure. Also worth noting that the worst performing sector during the 2018-2019 trade war was Semis, the same Semis which (thanks to NVDA) are literally propping up the entire market this time with its staggering earnings growth.
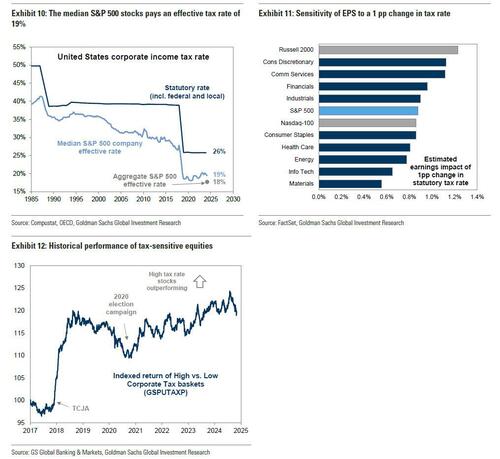
Separately, while it still remains to be seen whether the Republican Party will retain control the House and therefore be able to pass tax reform legislation (the most likely answer is yes), if the Trump proposal to reduce the statutory domestic corporate tax rate from 21% to 15% were enacted, it would boost our EPS estimate by approximately 4% (Exhibits 10-12).
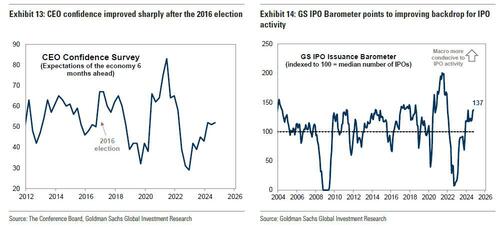
4. Outlook for Corporate M&A And IPO Activity: With Election Day now in the rear view mirror, the level of policy uncertainty should decline in the near future. The regulatory posture of the Federal Trade Commission (FTC) and the Department of Justice (DoJ) Antitrust Division that during the past four years challenged many proposed business combinations will likely be more relaxed under the incoming administration, especially once Lina Khan is purged with prejudice. CEO confidence will be a key variable affecting executives’ inclination to engage in M&A activity. Continued economic expansion coupled with an improvement in CEO confidence suggests M&A activity will increase next year.
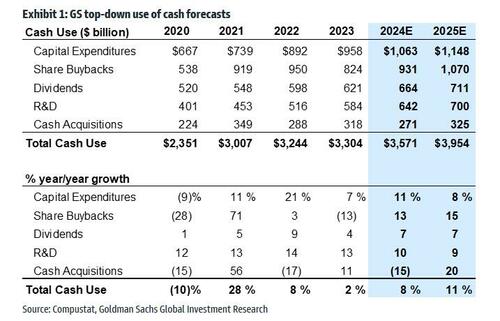
Goldman recently published its 2025 S&P 500 use of cash forecasts, and the bank expects cash spending will accelerate from +8% in 2024 to +11% in 2025. Furthermore, $4.0 trillion of spending in 2025 will be roughly evenly split between returning cash to shareholders (buybacks and dividends) and investing for growth (capex, R&D, and M&A).
Goldman’s cash M&A model suggests activity will rebound by 20% in 2025 following a 15% decline this year. Solid economic and EPS growth, relatively loose financial conditions, and contained equity market volatility should support activity. However, valuations will remain high relative to last year, making share consideration an attractive alternative to cash.
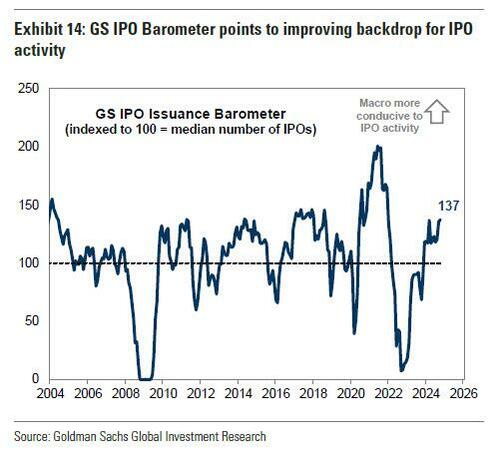
Goldman also expects a rebound in new issuance volume in 2025. The IPO Issuance Barometer is a metric to assess how conducive the macro environment is for new equity issuance. A reading of 100 represents a macro environment that is consistent with the typical historical frequency of IPOs. The barometer hit 201 in June 2021 at the peak of the post-Covid issuance boom and hit a nadir of just 7 in September 2022. Currently, the IPO barometer stands at 137, reflecting the solid macro environment for new issuance. (Exhibit 14).
Statistically, the S&P 500 index drawdown from its 52-week high is the most important metric in characterizing the environment for IPOs, followed by CEO confidence, ISM manufacturing index, change in 2-year Treasury yields, and S&P 500 valuation (EV/sales). Given the positive macro backdrop, the only sticking point preventing a jump in new issuance activity appears to be the reluctance of private equity and venture capital firms to recognize that the elevated corporate valuations of 2021 are unlikely to return in the foreseeable future. Simply put, real rates in 2021 were -1.0% and today they are +2.0%. Equity valuations compressed concurrent with the rise in interest rates. However, both the S&P 500 index level and valuation multiples are currently at all-time highs.
* * *
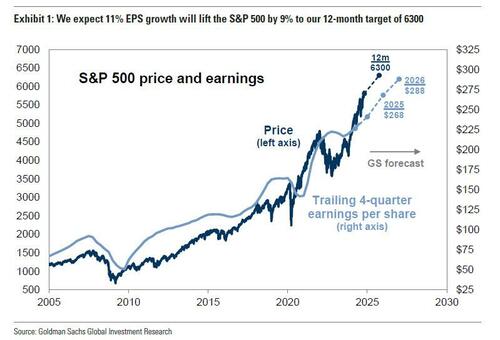
Putting it all together, Goldman maintains its 12-month S&P 500 index target of 6300, reflecting a 9% gain from the current level. Robust earnings growth should drive continued equity market appreciation into next year. We forecast EPS growth of 11% in 2025 and 7% in 2026, although those estimates may change as the new administration’s policy agenda comes into clarity. The prospect of trade conflict poses downside risk to these estimates, while the potential for changing regulatory and corporate tax policy pose upside risks.
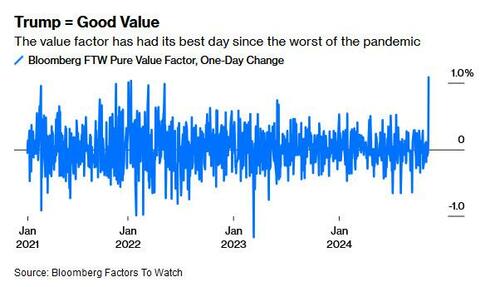
If Goldman is right, there is still substantial upside left in the broader market. But where is it most concentrated? According to Bloomberg’s John Authers, Trump 2.0 is thought to be good for growth, thanks to tax cuts and deregulation. And when growth is plentiful, investors look for stocks that are cheap. In these conditions, it’s value that’s in short supply, not growth. Hence, the value factor had its best day in the US since 2020:
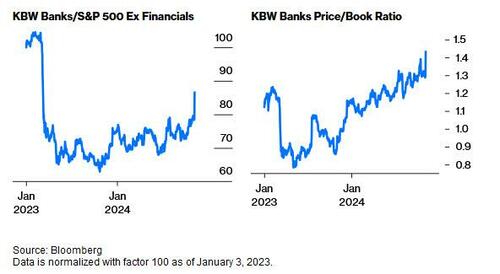
One place where the value rally is already surging is in banks. While shares in the sector are still a long way from making up all the ground lost when Silicon Valley Bank ran into trouble, their valuation is markedly higher than before the March 2023 crisis. There’s confidence both that deregulation will allow them to let rip, and that their balance sheets are proof against another potential surge in bond yields:
Same for the Russell 2000 index of small caps which gained almost 6% on Wednesday, its best day in two years. Elon Musk’s Tesla gained 14.75% for its best performance outside of results days since the pandemic. And so on. As Authers concludes, “this election felt like a big deal, and the markets fully confirm that.”
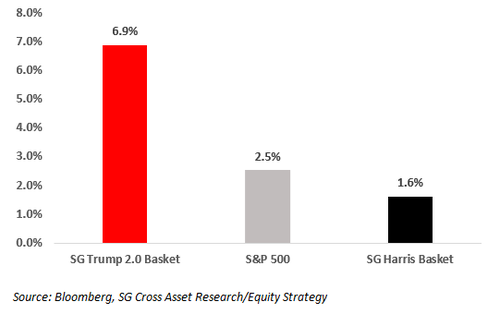
One final question is what is the shelf life of the Trump trades. Consider the following: within US equities, Crypto exchange +31%, Regional Banks +13%, Oil capex +9%, SG Reshoring +6%, or as SocGen’s Kabra Manish says, “Trump trades are in full bloom” (see below chart). This confirms previous observations that most upside for Trump trades was in equities as FICC was already pricing-in higher odds of Trump even before elections.
With this in mind, Manish says that US cyclical trades should continue to perform at least until the Inauguration Day (20th January) and fundamental trades like long US Reshoring beneficiary (SGIXUSRE) should continue to perform beyond the Inauguration date while those dependent on FED rate-cuts such as Small-caps will need to be revisited then.
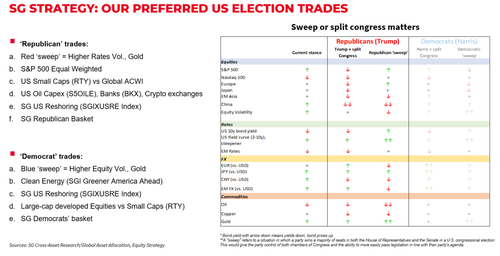
Manish recaps his key US equity trades and updates the cross-asset table from the bank’s lead strategists that uses a scoring system ranging from two arrows up (very positive) to two arrows down (very negative).
Finally, SocGen’s “blue-sky” scenario (i.e., not very probable) sees the S&P 500 at 6666 (Peak multiple of 25x PE on ’25 EPS of $267) but only if the US 10y yield stays <5%.

