

Uddrag fra Finanshuse:
Cross-currents
Here are the 12 charts you need to know this Tuesday morning.
Generally resilient
US equities are generally resilient to macro conflicts.
MS: “While this is not an exhaustive study, based on 14 events over the last few decades (generally major, as well as some recent smaller Iran related incidents) the S&P 500 is generally range bound following the start of a conflict. The event causing the largest drawdown in this sample was September 11th, 2001.”
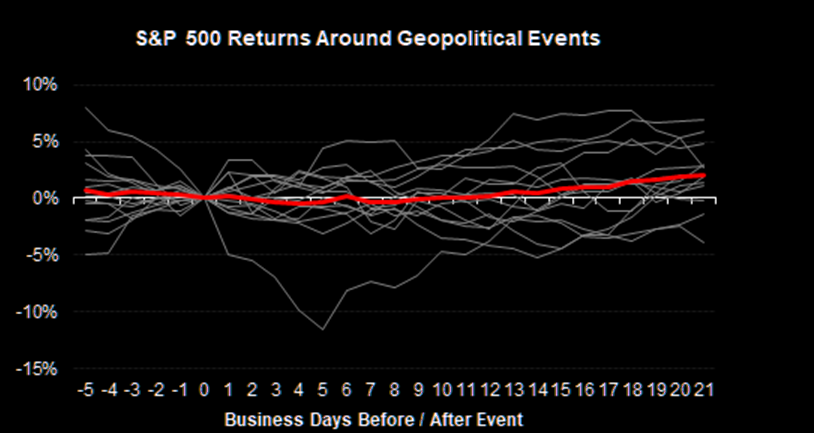
Source: MS QDS
Well hedged
Investors currently hold nearly the largest amount of S&P 500 put protection as they ever have.
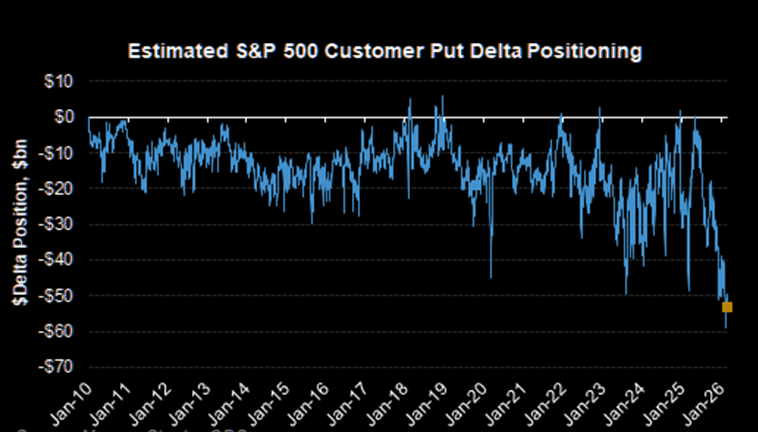
Source: MS QDS
Shrinking range
Here is a chart on S&P 500’s incredibly shrinking trading range. These are bands based on standard deviations above and below the 50-DMA.
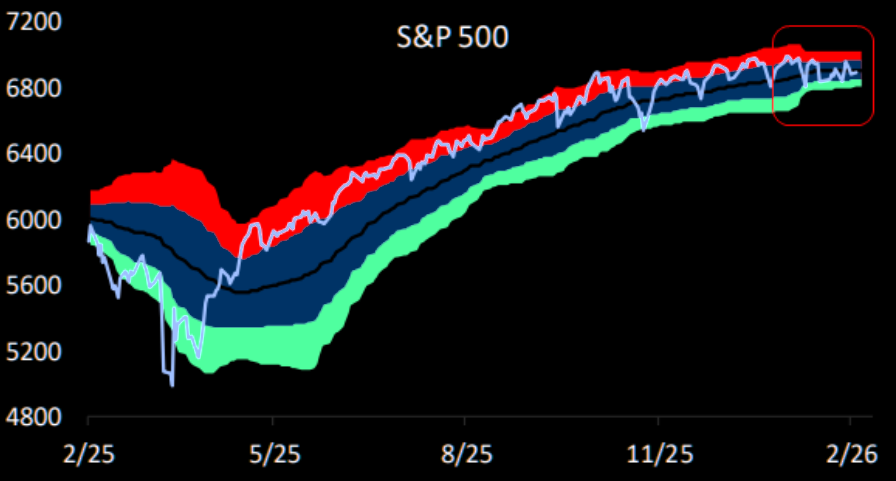
Source: Bespoke
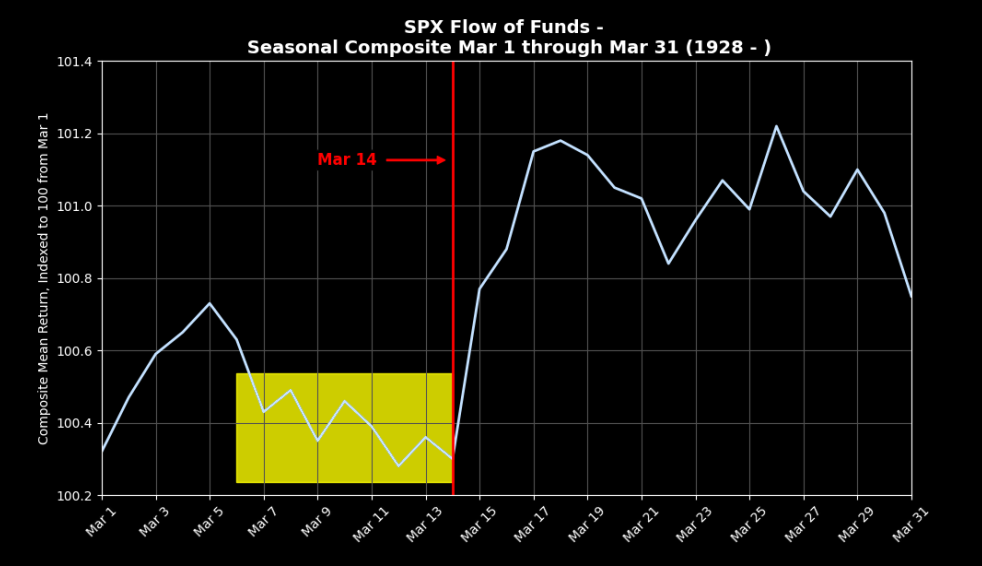
Seasonality
GS: “March tends to be a soggier month for the S&P historically as the first half faces choppy price action downwards but ultimately sees an average return of 30 bps from March 1 to March 14th.”
Source: GS
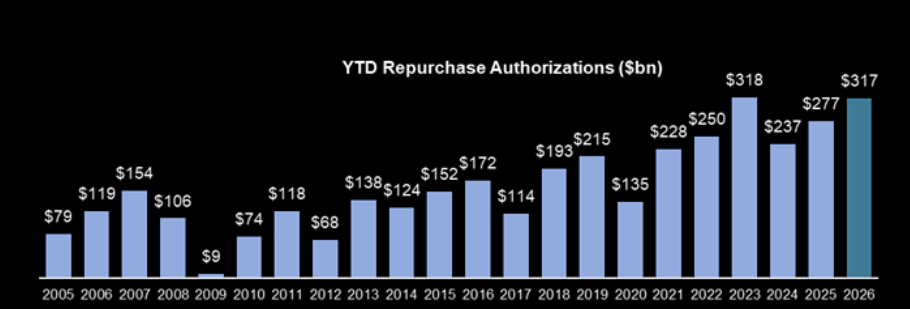
Buyback blackout
Buybacks remain in full swing as last week finished 1.7x vs. 2025 YTD ADTV and 1.5x vs 2024 YTD ADTV. Buybacks remain a tailwind for US equities into mid-March and taper off from there.
GS: “While we don’t think buybacks are in themselves enough to catalyze a push higher, the removal of these flows would exacerbate an already shaky tape. We expect the next blackout window to start ~3/16 and is expected to run through end of April.”
In terms of authorizations, 2026 YTD authorizations are the 2nd most active standing at $317B, just behind 2023 YTD which was $318B.
Source: GS
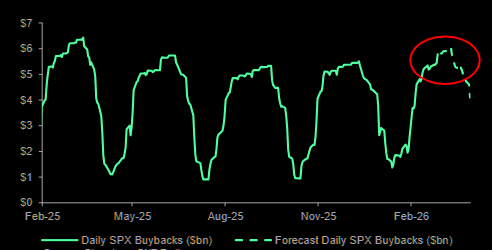
Peak buyback
BNP: “Corporate buybacks are at a peak of $6bn/day for the next few weeks.”
Source: BNP
So many “neutral” indicators
Unchanged
BofA: “Sell Side Indicator was unchanged in February at 56%.”
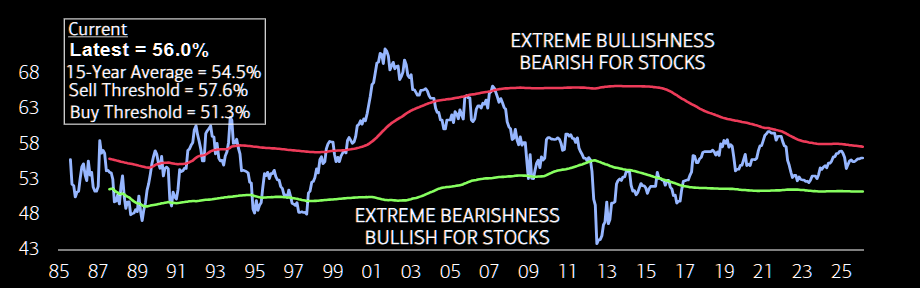
Source: BofA Quant
Cash taking a ride on the flat-line
Cash allocations have held steady in recent months.
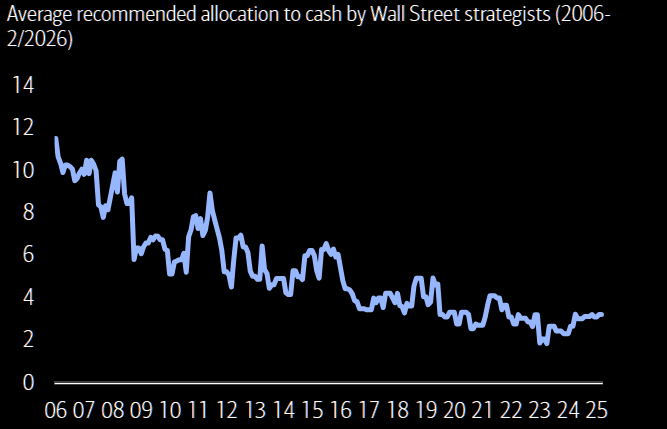
Source: BofA Quant
Neutral indicator
Risky vs. safe assets fund flows.
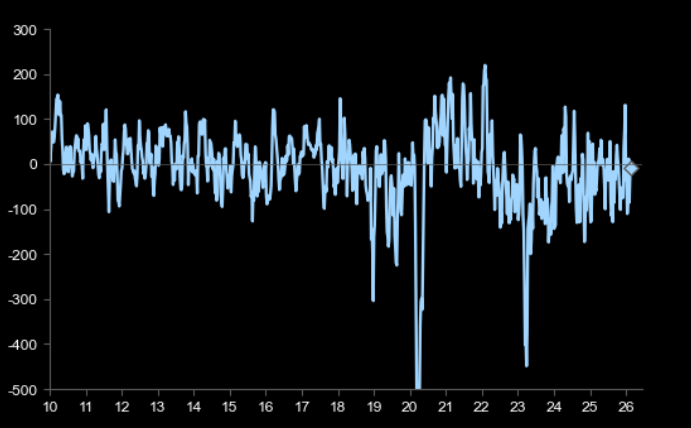
Source: EPFR
Hedge fund nets
US L/S HF nets are 56%, the 75th %ile versus the last year per MS PB Content. Hedge Funds have generally kept nets in a 49% to 59% range since last April, with flows showing more fragility when nets are in the high 50s while more dip buying in the 49-51% range. At 56% nets are not necessarily in the danger zone, but also have room to move lower as well.
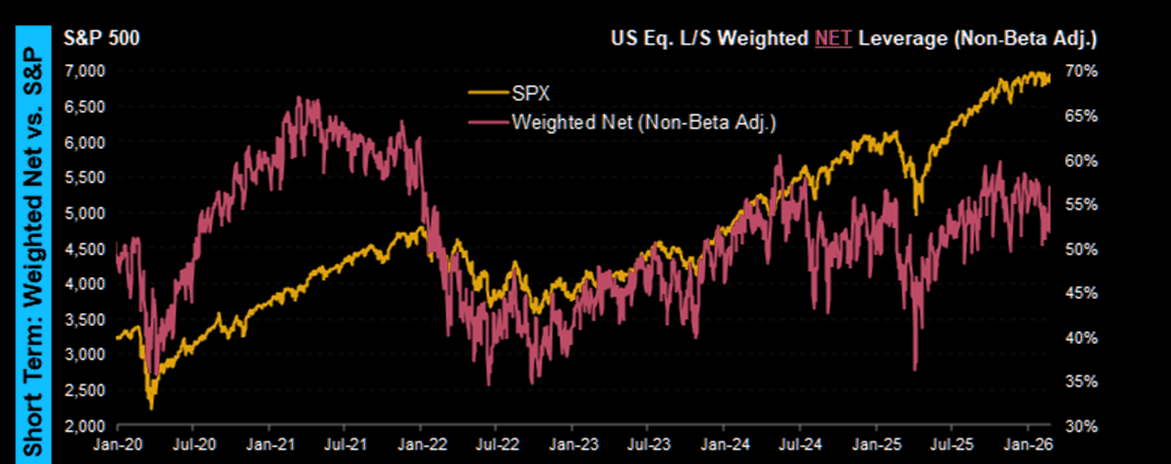
Source: MS PB
Off the lows
BNP: “Our US Equity Positioning Indicator (BNPEPUS) has come off the lows, now 34/100, in defensive territory despite the market near all-time highs.”
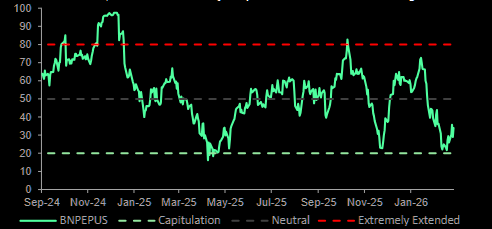
Source: BNP
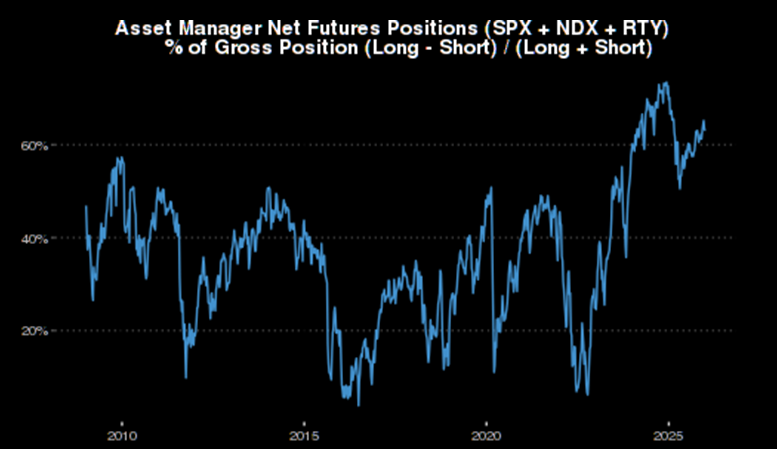
Futures flows have been strongly to buy this year
The MS futures team noted on Friday that Asset Managers added $30.5 billion notional of new longs (3% of total open interest) in the two weeks ending February 24 per CFTC data, the most longs Asset Managers added in a two-week period as a % of open interest since January 14, 2018. Looking at futures length another way through the lens of MS Trade Pressure metrics, over the last two months futures demand has been $55bn to buy, a 1.7 z-score amount looking back to 2010. Asset Manager exposure to equities via futures has only been fuller than it is now during 3Q 2025