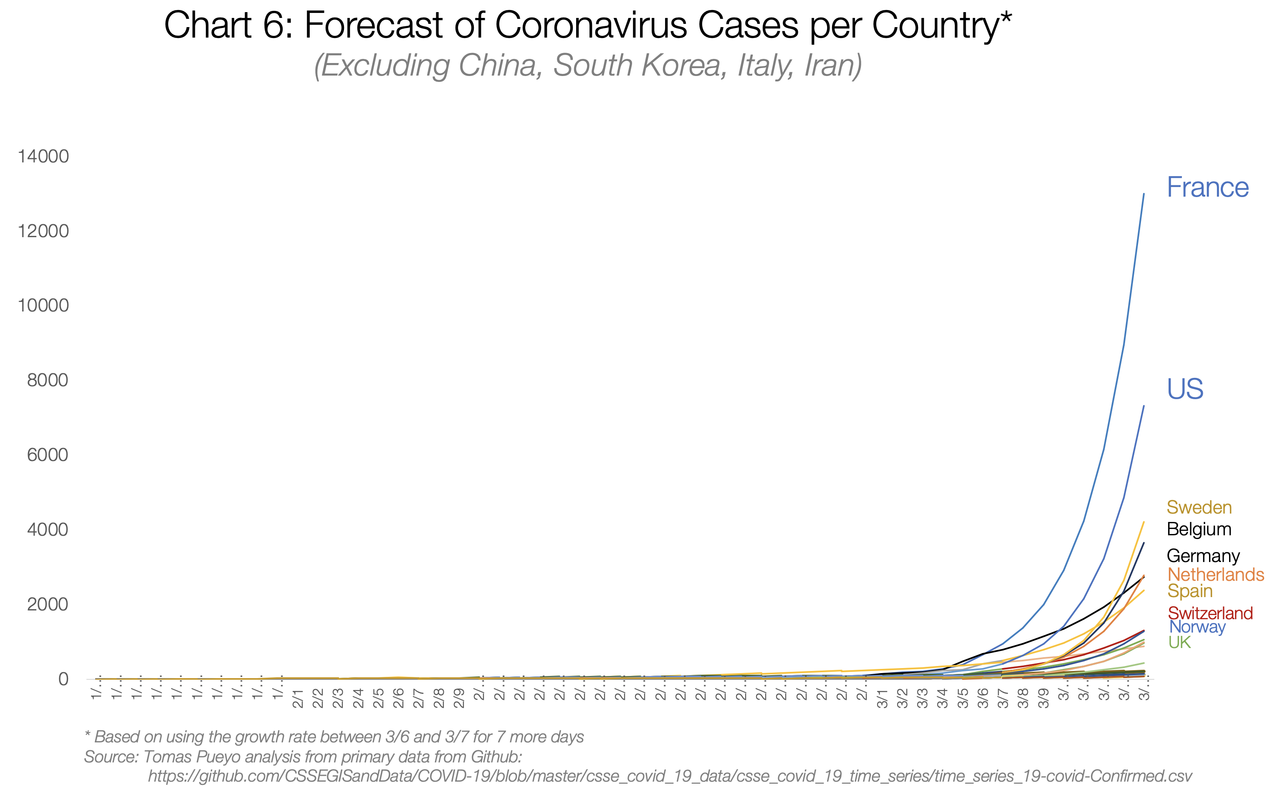
As of today, this is mostly due to Italy, Iran and South Korea:
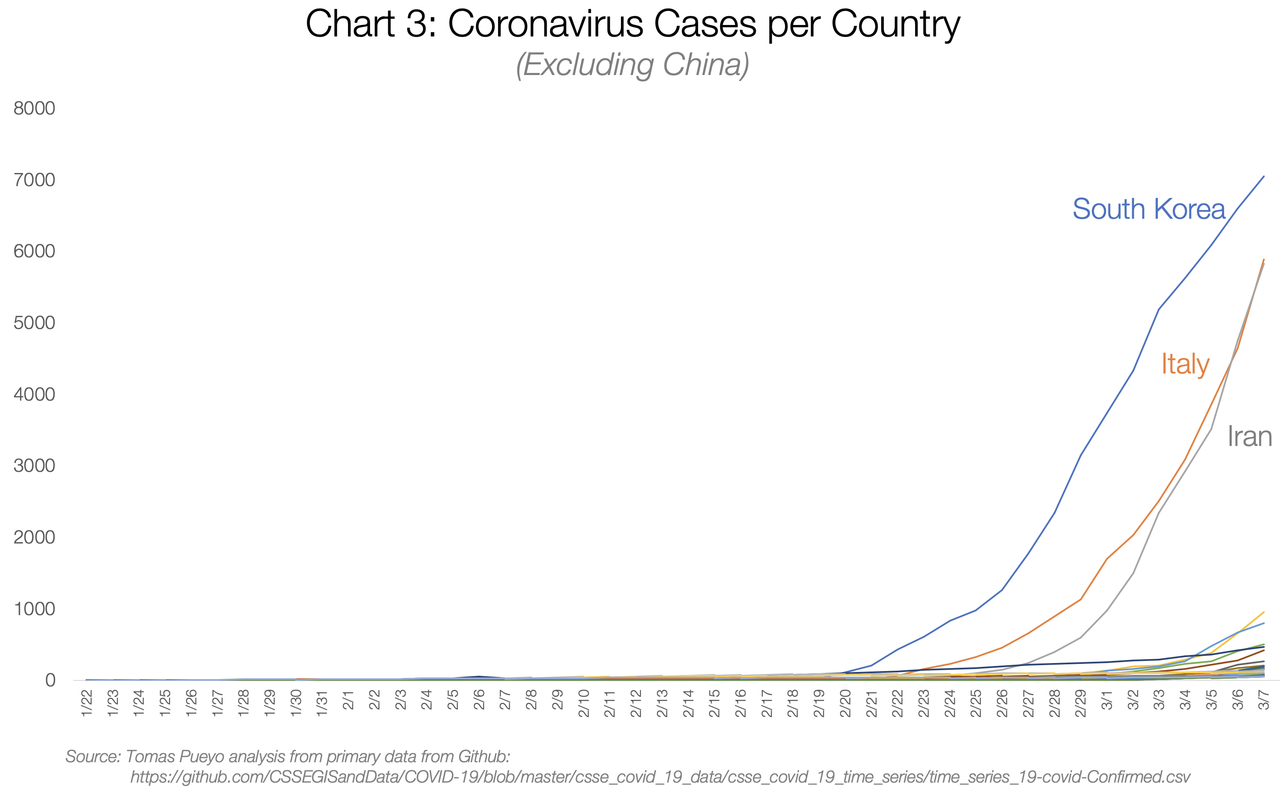
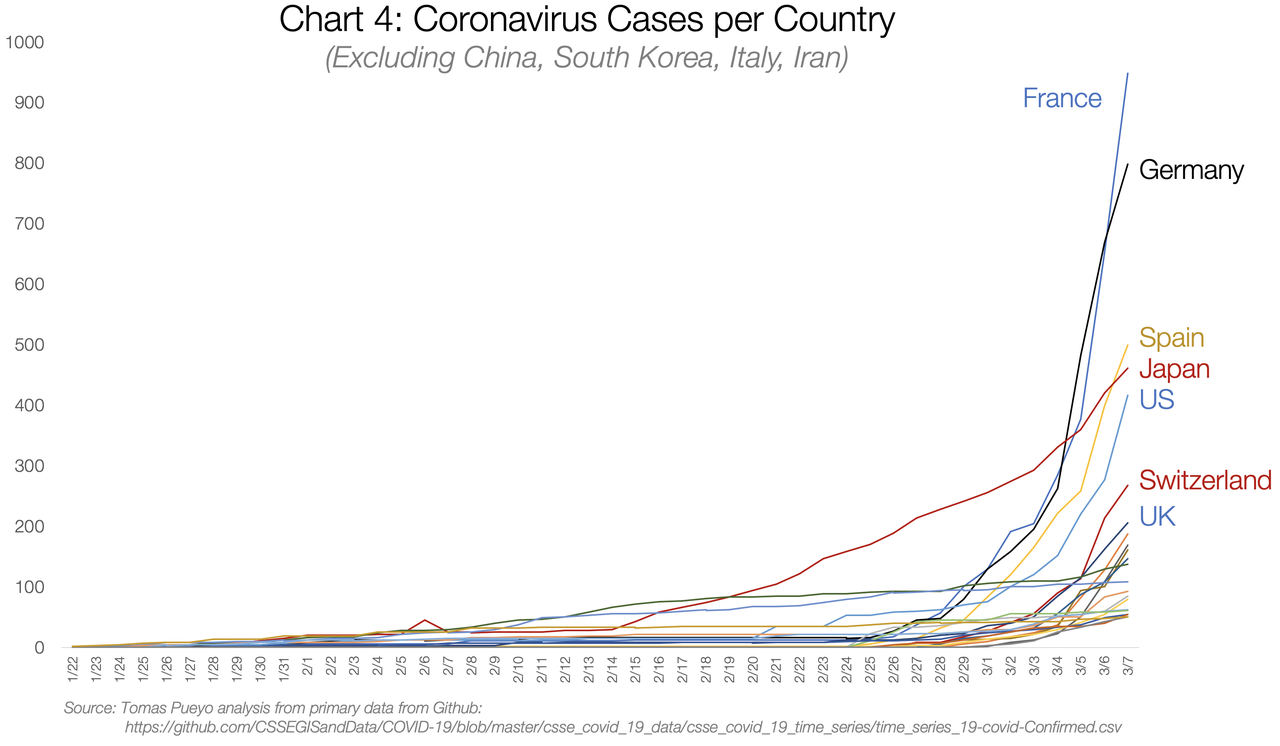
There are so many cases in South Korea, Italy and Iran that it’s hard to see the rest of the countries, but let’s zoom in on that corner at the bottom right.
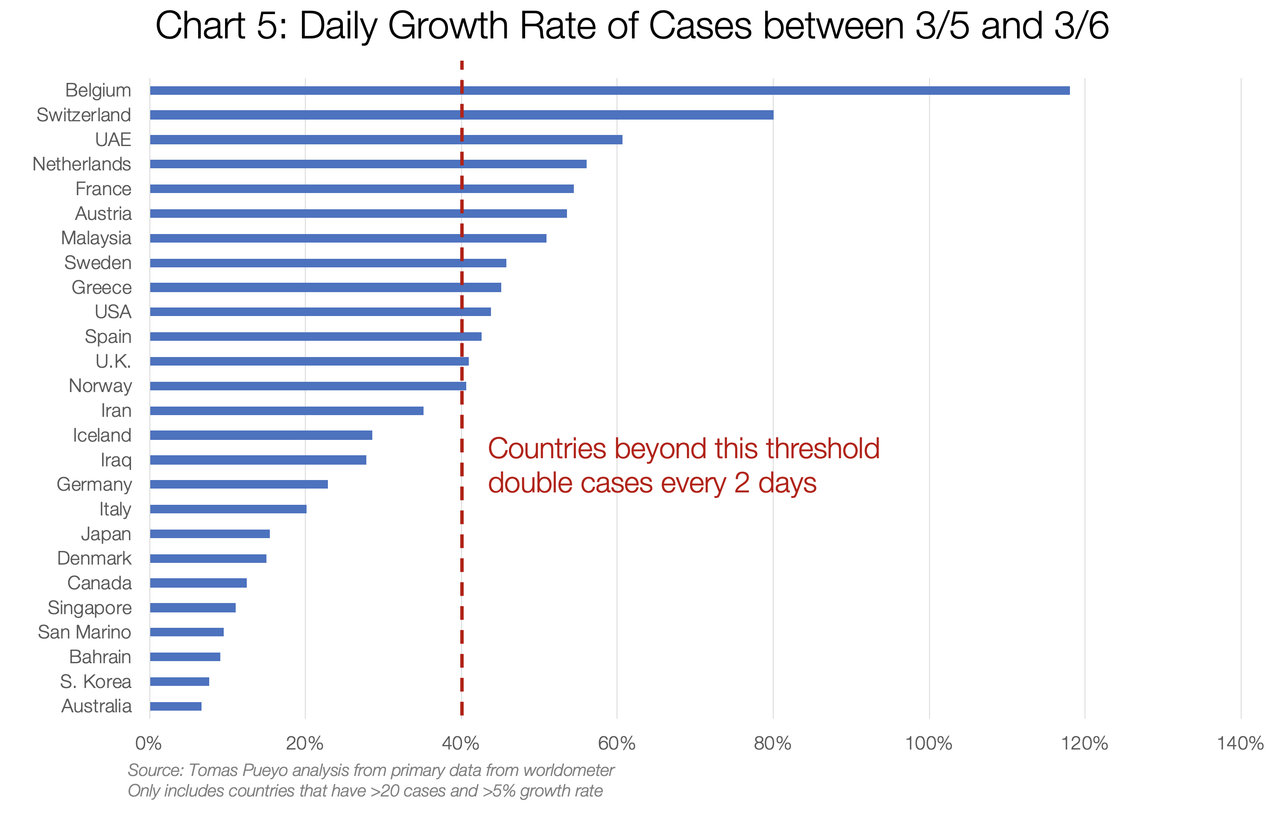
There are dozens of countries with exponential growth rates. As of today, most of them are Western.
If you keep up with that type of growth rate for just a week, this is what you get:
If you want to understand what will happen, or how to prevent it, you need to look at the cases that have already gone through this: China, Eastern countries with SARS experience, and Italy.
China
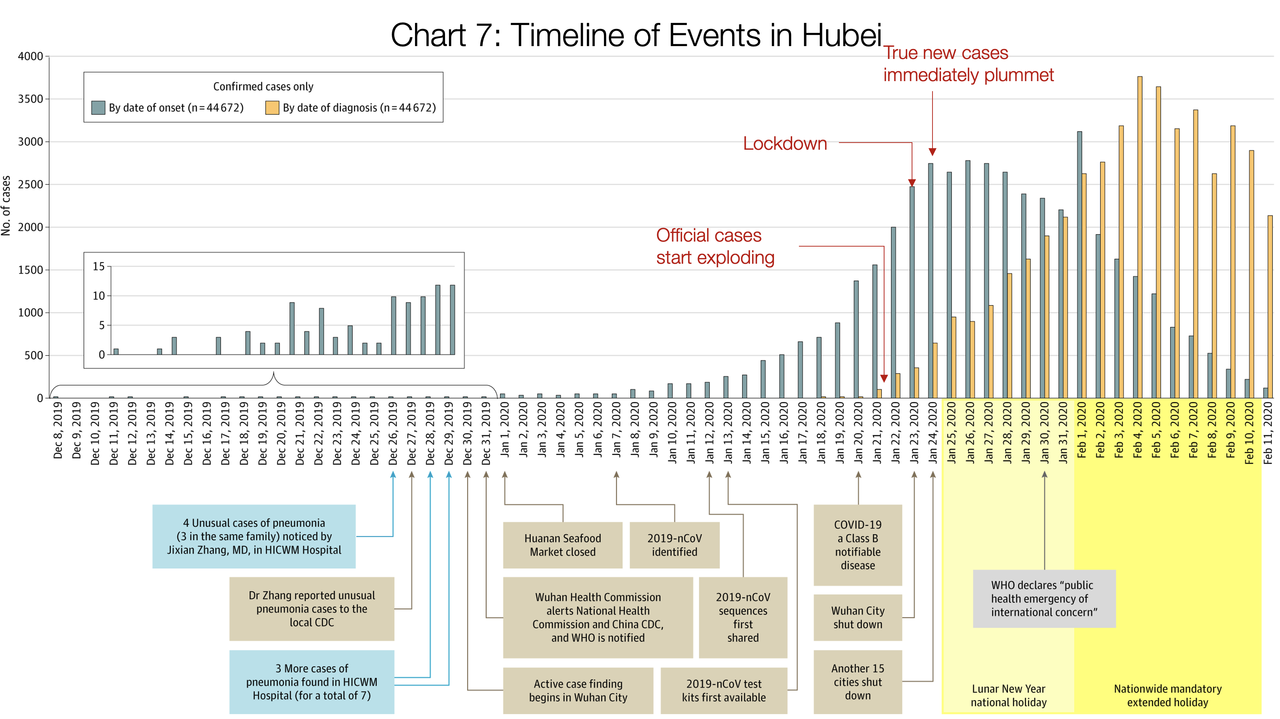
Source: Tomas Pueyo analysis over chart from the Journal of the American Medical Association, based on raw case data from the Chinese Center for Disease Control and Prevention
This is one of the most important charts.
It shows in orange bars the daily official number of cases in the Hubei province: How many people were diagnosed that day.
The grey bars show the true daily coronavirus cases. The Chinese CDC found these by asking patients during the diagnostic when their symptoms started.
Crucially, these true cases weren’t known at the time. We can only figure them out looking backwards: The authorities don’t know that somebody just started having symptoms. They know when somebody goes to the doctor and gets diagnosed.
What this means is that the orange bars show you what authorities knew, and the grey ones what was really happening.
On January 21st, the number of new diagnosed cases (orange) is exploding: there are around 100 new cases. In reality, there were 1,500 new cases that day, growing exponentially. But the authorities didn’t know that. What they knew was that suddenly there were 100 new cases of this new illness.
Two days later, authorities shut down Wuhan. At that point, the number of diagnosed daily new cases was ~400. Note that number: they made a decision to close the city with just 400 new cases in a day. In reality, there were 2,500 new cases that day, but they didn’t know that.
The day after, another 15 cities in Hubei shut down.
Up until Jan 23rd, when Wuhan closes, you can look at the grey graph: it’s growing exponentially. True cases were exploding. As soon as Wuhan shuts down, cases slow down. On Jan 24th, when another 15 cities shut down, the number of true cases (again, grey) grinds to a halt. Two days later, the maximum number of true cases was reached, and it has gone down ever since.
Note that the orange (official) cases were still growing exponentially: For 12 more days, it looked like this thing was still exploding. But it wasn’t. It’s just that the cases were getting stronger symptoms and going to the doctor more, and the system to identify them was stronger.
This concept of official and true cases is important. Let’s keep it in mind for later.
The rest of regions in China were well coordinated by the central government, so they took immediate and drastic measures. This is the result:
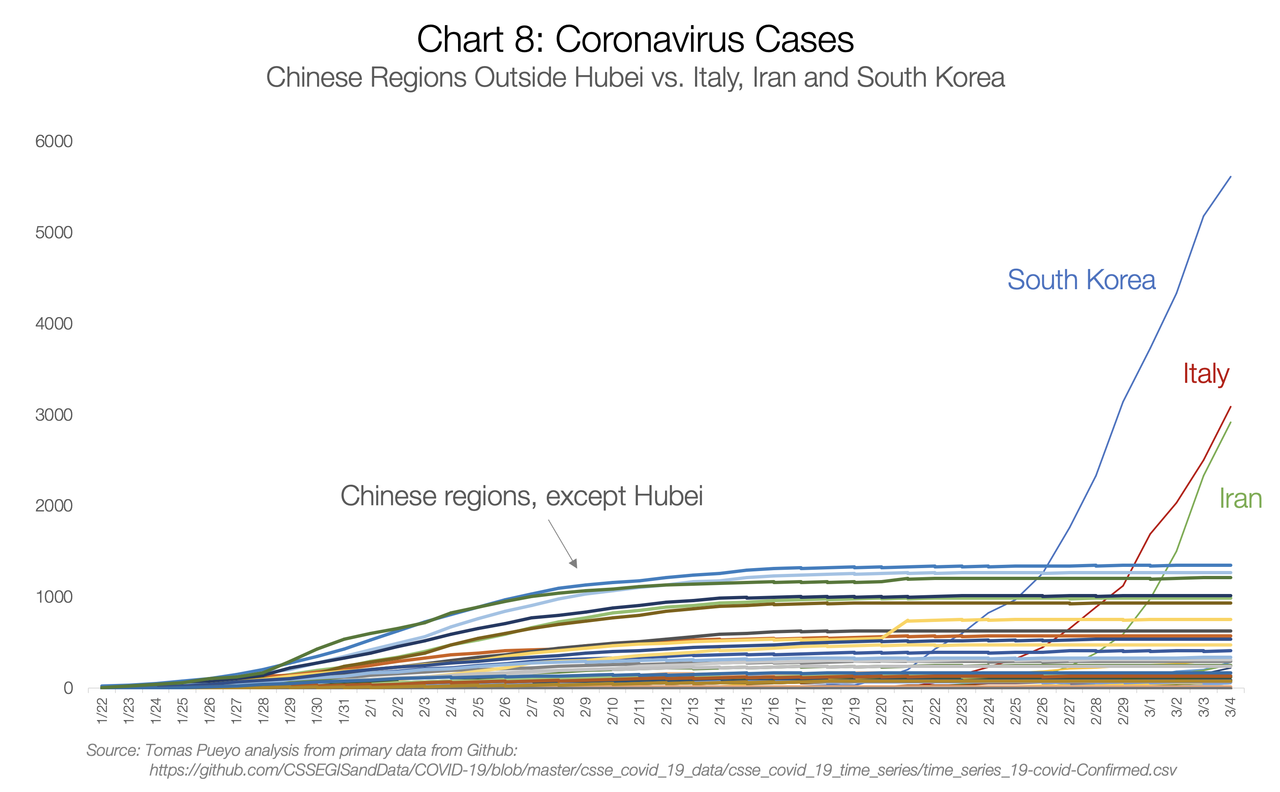
Every flat line is a Chinese region with coronavirus cases. Each one had the potential to become exponential, but thanks to the measures happening just at the end of January, all of them stopped the virus before it could spread.
Meanwhile, South Korea, Italy and Iran had a full month to learn, but didn’t. They started the same exponential growth of Hubei and passed every other Chinese region before the end of February.
Eastern Countries
South Korea cases have exploded, but have you wondered why Japan, Taiwan, Singapore, Thailand or Hong Kong haven’t?
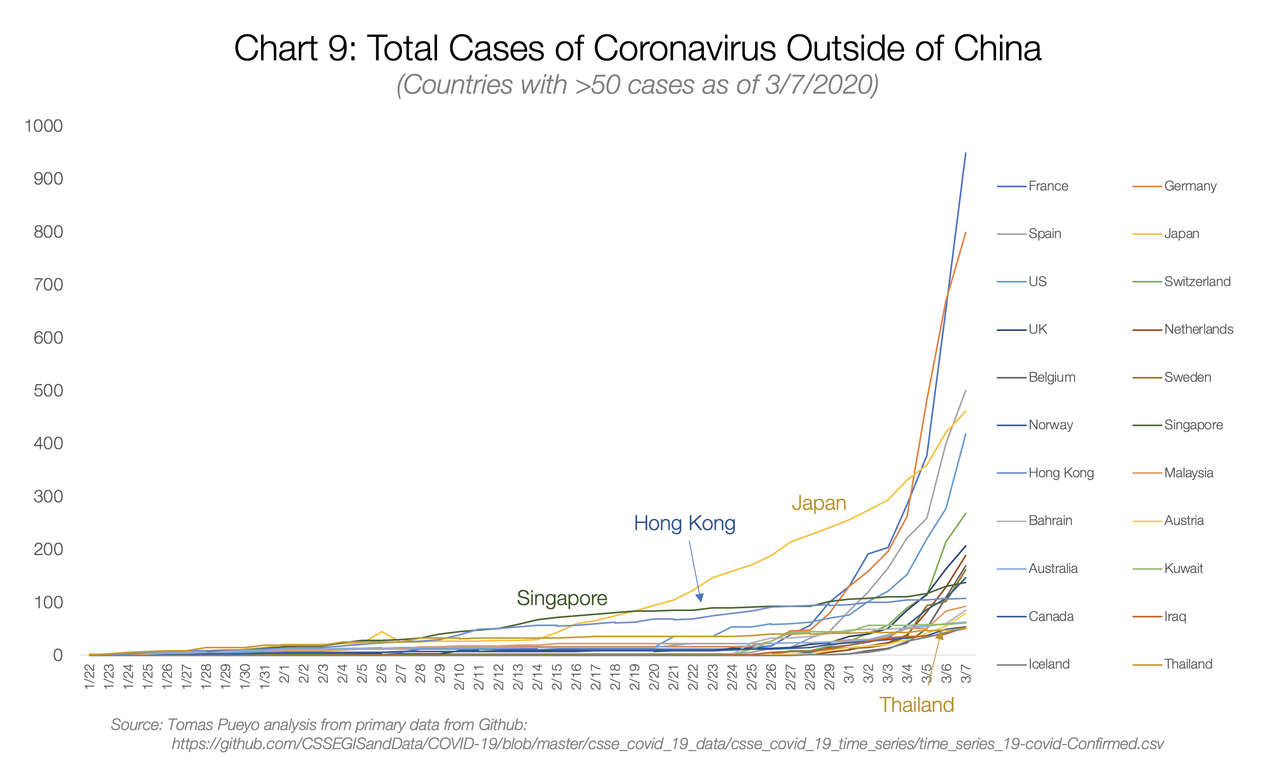
Taiwan didn’t even make it to this graph because it didn’t have the 50 cases threshold that I used.
All of them were hit by SARS in 2003, and all of them learned from it. They learned how viral and lethal it could be, so they knew to take it seriously. That’s why all of their graphs, despite starting to grow much earlier, still don’t look like exponentials.
So far, we have stories of coronavirus exploding, governments realizing the threat, and containing them. For the rest of the countries, however, it’s a completely different story.
Before I jump to them, a note about South Korea: The country is probably an outlier. The coronavirus was contained for the first 30 cases. Patient 31 was a super-spreader who passed it to thousands of other people. Because the virus spreads before people show symptoms, by the time the authorities realized the issue, the virus was out there. They’re now paying the consequences of that one instance. Their containment efforts show, however: Italy has already passed it in numbers of cases, and Iran will pass it tomorrow (3/10/2020).
Washington State
You’ve already seen the growth in Western countries, and how bad forecasts of just one week look like. Now imagine that containment doesn’t happen like in Wuhan or in other Eastern countries, and you get a colossal epidemic.
Let’s look at a few cases, such as Washington State, the San Francisco Bay Area, Paris and Madrid.
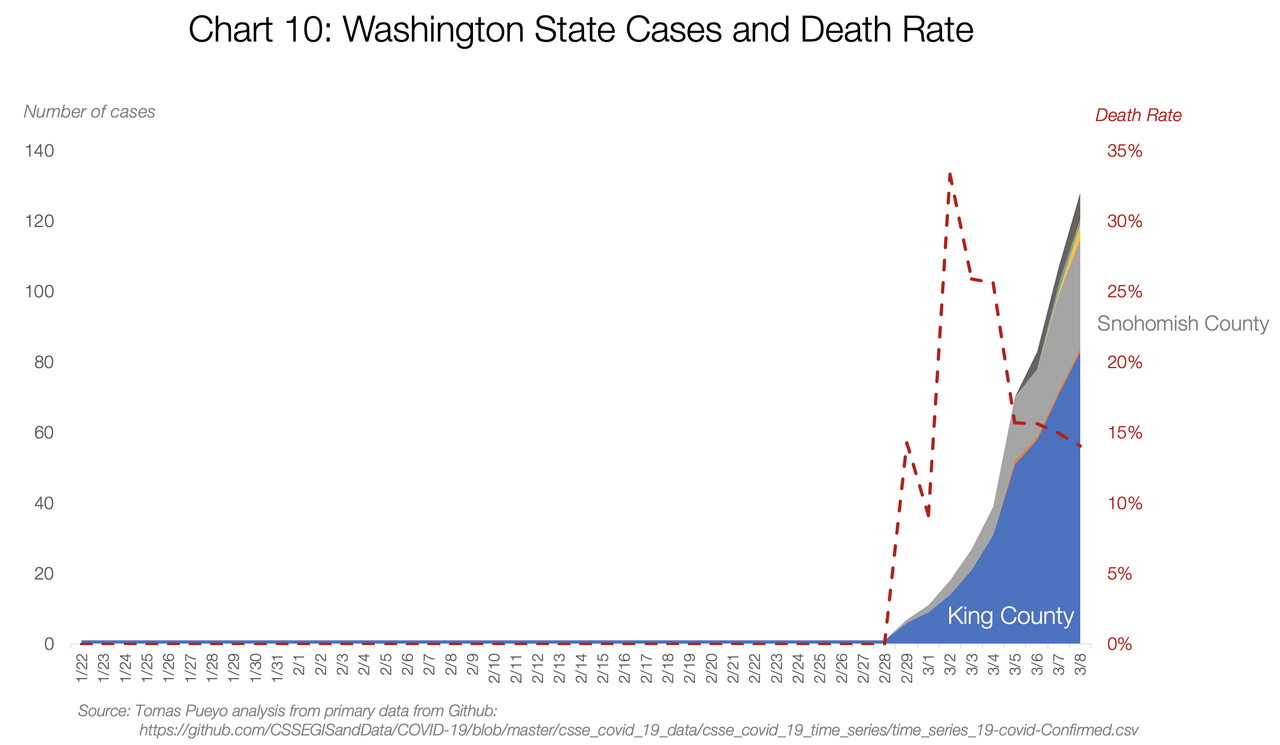
Washington State is the US’s Wuhan.The number of cases there is growing exponentially. It’s currently at 140.
But something interesting happened early on. The death rate was through the roof. At some point, the state had 3 cases and one death.
We know from other places that the death rate of the coronavirus is anything between 0.5% and 5% (more on that later). How could the death rate be 33%?
It turned out that the virus had been spreading undetected for weeks. It’s not like there were only 3 cases. It’s that authorities only knew about 3, and one of them was dead because the more serious the condition, the more likely somebody is to be tested.
This is a bit like the orange and grey bars in China: Here they only knew about the orange bars (official cases) and they looked good: just 3. But in reality, there were hundreds, maybe thousands of true cases.
This is an issue: You only know the official cases, not the true ones. But you need to know the true ones. How can you estimate the true ones? It turns out, there’s a couple of ways. And I have a model for both, so you can play with the numbers too (direct link to copy of the model).
First, through deaths. If you have deaths in your region, you can use that to guess the number of true current cases. We know approximately how long it takes for that person to go from catching the virus to dying on average (17.3 days). That means the person who died on 2/29 in Washington State probably got infected around 2/12.
Then, you know the mortality rate. For this scenario, I’m using 1% (we’ll discuss later the details). That means that, around 2/12, there were already around ~100 cases in the area (of which only one ended up in death 17.3 days later).
Now, use the average doubling time for the coronavirus (time it takes to double cases, on average). It’s 6.2. That means that, in the 17 days it took this person to die, the cases had to multiply by ~8 (=2^(17/6)). That means that, if you are not diagnosing all cases, one death today means 800 true cases today.
Washington state has today 22 deaths. With that quick calculation, you get ~16,000 true coronavirus cases today. As many as the official cases in Italy and Iran combined.
If we look into the detail, we realize that 19 of these deaths were from one cluster, which might not have spread the virus widely. So if we consider those 19 deaths as one, the total deaths in the state is four. Updating the model with that number, we still get ~3,000 cases today.