
Uddrag fra Goldman:
If there’s anything to note about the anatomy of the US rally, Pasquariello argues it was improved breadth within the market (as you can see in the first point below, strength came from both secular growers AND the old economy sectors).
None of this is to say that the setup was necessary easy, as both multiples and positioning felt stretched the entire time.
In the end, however, S&P has again blown past all of the off ramps to mark higher highs, generating an 11% total return on 11% realized volatility.
As we exit Q1, the Goldman trader says it’s fair to question how sustainable the strength will be — as remarked at various points, this has been one of the most powerful 5-month rallies in market history (a 99th percentile return, in fact, since the lows of October).
In this context, Pasquariello appropriates a comment from Dominic Wilson: this is a macro environment where valuations trade rich, yet implied volatility trades cheap.
So, as we cross into Q2, here’s where I’m going with all this: it’s a bull market and the primary trend is higher, but risk/reward has changed … therefore, stick with the plan of retaining core length in the highest conviction parts of your portfolio, while using options to risk manage the path.
What follows from here are 24 punchy charts that stand out to Goldman’s top trader…
1. this is a snapshot of Q1 returns, both outright and risk-adjusted. a few things stuck out to me here: financials had the highest Sharpe ratio on the board (very few would have called that) … while tech understandably received a ton of air time, note how well the traditional cyclical spaces performed (energy, industrials) … and BTC handily outperformed everything thing:

2. it’s not a new story at all, and if anything the next few weeks will be constrained by blackouts, but when you step back, the fact is this: the single biggest technical in the US equity market is still corporate stock repurchase. as you can see here, our recently refreshed estimates for executions this year and next year are very healthy … call it an average of $1tr per annum:

3. to put a line under that story, consider this: since the year 2000, US corporations have, on net, bought back $5.5 tr of stock. again, this has amounted to more demand than any other market participant, and it’s not even close:

4. like stock buybacks, I probably talk about the Magnificent Seven a bit too much. that said, consider this side-by-side comparison of revenue growth for the “7” vs the “493” at various times in recent history — here I’ll emphasize that in the 2023-25 period, we forecast a revenue outperformance of … 4x:

5. here’s another way to frame it … the consensus estimate for net income growth of the 7 and the 493 (thanks to Cormac Conners):

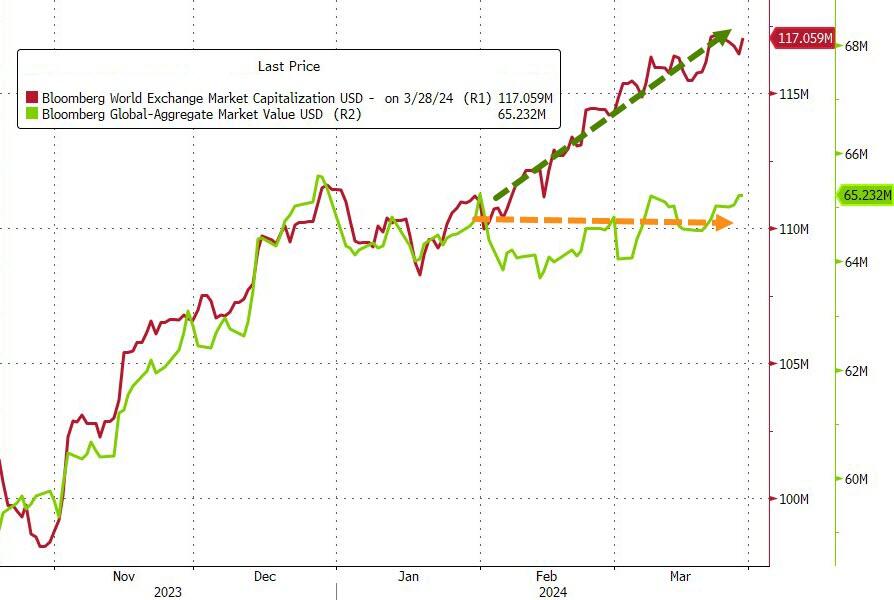
6. working from there, consider this regional comparison of market cap growth over recent years (credit to Marcus von Scheele):

7. here’s where I’m going with that sequence … the outperformance of the US equities over ROW has tracked the outperformance of US earnings growth (heavily influenced, of course, by US tech companies):

8. back to the macro: this is a simple progression of our estimates for quarterly US GDP growth in 2024 (thanks Chelsea Song). I would also note here that we expect the Fed to cut rates three times this year, starting in June. therefore, if our team is correct, the moral of the story is this: the Fed will be easing policy alongside an upswing in growth. framed one way, that’s the photographic negative of 2022, when we were tightening into a slowdown. while I suspect these expectations are already reflected in a 21x P/E, this growth/Fed interplay should nonetheless provide a bulwark for the market on a selloff:

9. a big picture chart that jumps off the page. in the context of the US election, I imagine that US/China acrimony remains front-and-center:

10. speaking of the election, if there are two assets to watch from here to November 5th, I reckon it will be the S&P (as an outfitter once remarked to me, “don’t you know, the stock market runs the table”) and the price of gasoline (at the pump, as displayed here):

11. as mentioned before, using 5y5y forward breakevens as proxy, the market revised its forward inflation expectations up significantly after the lows of 2020. since the spring of 2022, that view has been remarkably stable, notably through the most intimidating moments of the realized inflation scare that year. read a certain way, the market assigned a high degree of credibility to the Fed (or, perhaps, was never of the view inflation could structurally run very far). if you flash forward to today, however, I find it a little interesting that this metric is NOT trending lower:

12. on the topic of US rates, one feature of the recent trading environment has been a marked compression in bond market volatility … with implieds trending back to where they were before the Fed began blasting away in March of 2022:

13. which leads to this: the implied volatility of a 3-month expiry, 25-delta put on S&P. as I’ve been mentioning in the context of navigation, the important idea here is this … the availability of cheap hedges has made it possible to maintain large portfolio exposure into big events along the 2024 path (such that the option premium has largely paid for itself):

14. that sequence of charts also connects to this one, which you’ve seen before: our simplified carry strategy that cuts across four asset classes (currencies, commodities, rates and equities). as you can see, following a plateau in H2’23, this has resumed a very long and durable uptrend:

15. the hunting has been exceptional in Japan (arguably via the currency, certainly via equities). an example: in total returns, the Japanese banks have doubled in the past 24 months; by contrast, the index of US banks is down over that same time frame. here’s a simple snapshot of NKY, up 21% in Q1 alone:

16. on the topic of non-dollar markets, to again give credit where it’s due, European equities have been very strong over the past 18 months. and, positioning has followed suit: GS PB reports that clients are the most overweight European equities — relative to benchmark — as they have been at any point (on a data set that goes back to 2008). with that said, I’m very curious to see if SX5E (as distinct from SXXP) can finally take out the highs from way back in 2000:

17. this is something to keep an eye on: the US momentum factor (a high-vs-low pair). all year long, this factor has been exceedingly strong. this week, however, saw some significant retracement (also note that April is typically the single worst month for momentum):

18. another eye-popper, our “Power Up America” basket, represented here as a pair trade vs S&P. again, these are the names that should benefit from immense forward demand for power, which again I see as a massive opportunity set over time:

19. coming off an 81% rally last year, this year has seen another strong run for US homebuilding stocks. bigger picture, the COVID era has been spectacular for these names:

20. then again, when run as a ratio vs S&P, the relative performance of the homebuilders is far less impressive:

21. to conclude, the final set of charts here are the most interesting themes that I’ve been tracking for a while. I should note that each of these showed a touch of wear-and-tear this past week, which hits on the earlier point about a local momentum reversal. anyway, this is the US onshoring-vs-offshoring pair trade:

22. this is the pair trade for the GLP-1 wonder drug theme:
23. strong balance sheets vs weak balance sheets:


24. finally, as you’ve now seen several times before, this is the AI leaders-vs-laggards pair trade: