Uddrag fra Goldman Sachs
Below we highlight the 10 key charts that Goldman’s Sales & Trading team are currently watching and discussing most…
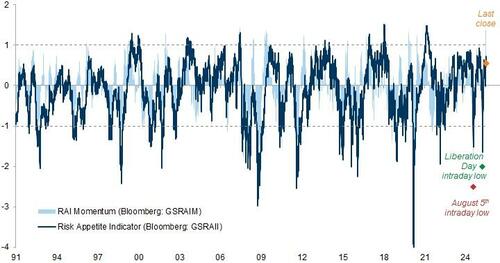
Exhibit 1: Our Risk Appetite Indicator (RAI) has recovered very quickly after dropping to near -2 around ‘Liberation day’
Source: Datastream, Haver Analytics, Goldman Sachs Global Investment Research
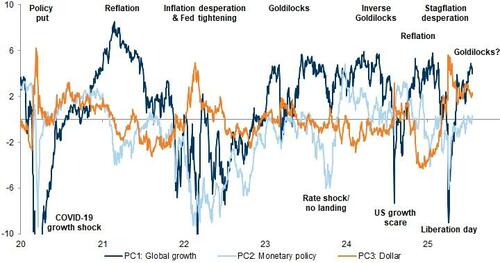
Exhibit 2: Market narrative volatility has been high with large shifts in cross-asset pricing – recently Goldilocks has taken over
RAI principal components
Source: Datastream, Haver Analytics, Goldman Sachs Global Investment Research
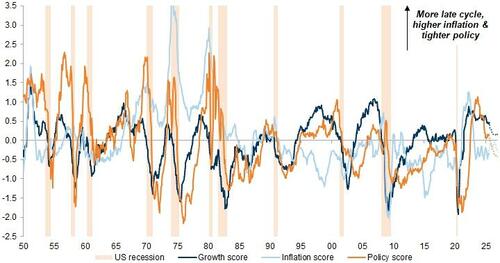
Exhibit 3: Our US macro baseline points to some stagflationary momentum in 2H
Average expanding z-score of macro and market variables across growth, inflation and policy. Dotted line based on GIR forecasts.
Source: Haver Analytics, Bloomberg, Datastream, Goldman Sachs Global Investment Research
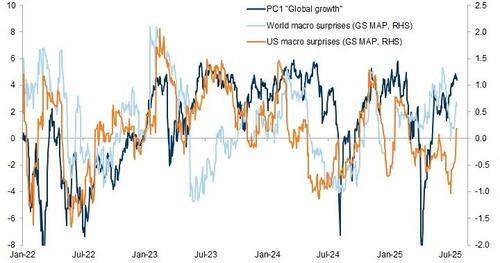
Exhibit 4: Markets priced higher growth expectations, looking through recent negative macro surprises
Source: Goldman Sachs Global Investment Research
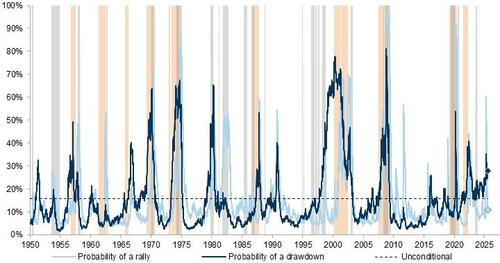
Exhibit 5: Elevated valuations and more mixed macro data point to modestly negative asymmetry for equities near-term
Probability of S&P 500 drawdown/rally based on multi-variate logit model (Orange/ light grey shading = S&P 500 subsequent drawdown >-20%/ rally >+35%)
Source: Datastream, Haver Analytics, Goldman Sachs Global Investment Research
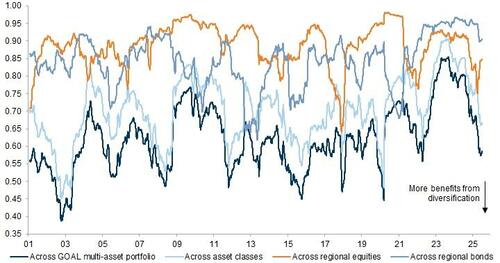
Exhibit 6: Diversification benefits across assets and equity regions have increased YTD
1-year rolling portfolio volatility/ volatility assuming no diversification. Based on GOAL benchmark assets and weights (all in USD, monthly returns)
Corporate credit (avg.): BBB vs. AAA, IG Credit, HY Credit. G10 + EM FX is the average between: the carry of top vs. bottom 3 G10 carry strategy and Top 5 EMFX strategy. G10 sovereign is the average carry of Italy, Spain, France, Greece and Portugal versus the Euro area benchmark. EM sovereign carry is calculated on the EM sovereign spread in USD. History extended based on BBB vs. AAA spreads.
Source: Bloomberg, Haver Analytics, Datastream, Goldman Sachs Global Investment Research
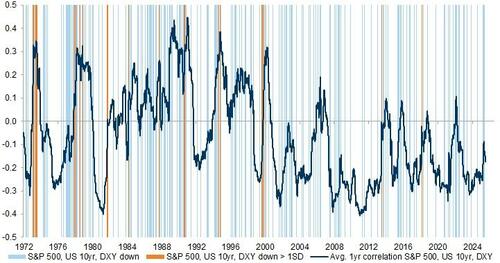
Exhibit 7: The Dollar, S&P 500 and US treasuries have seldom sold off together since the 1990s but more frequently before
Based on monthly changes
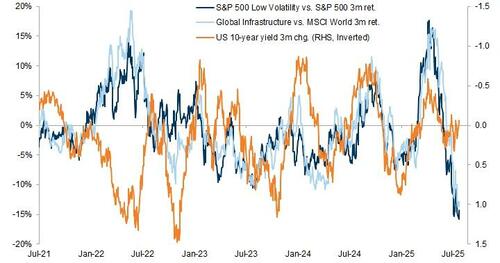
Selective defensive equities like low volatility stocks and global infrastructure can help diversify growth risk, even without material rates relief (such as in 2022)
Source: Bloomberg, Haver Analytics, Goldman Sachs Global Investment Research
Exhibit 8: In 2022 global infrastructure and low volatility stocks managed to outperform despite rising yields
Source: Datastream, Goldman Sachs Global Investment Research
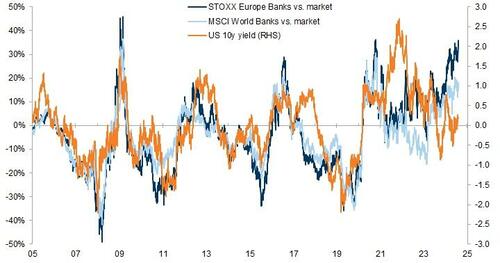
Exhibit 9: Banks globally tend to benefit from higher rates but have outperformed more recently due to other tailwinds
Y/Y return (LHS) and change in yield (RHS)
Source: Bloomberg, Goldman Sachs Global Investment Research
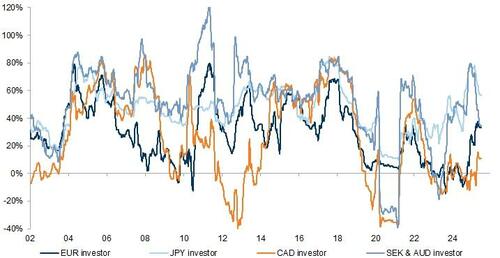
Exhibit 10: The risk contribution of FX in multi-asset portfolios for non-US investors has picked up in the last 12 months
12m rolling contribution of FX to multi-asset portfolio variance (60% MSCI World, 40% Bloomberg global agg., monthly returns)
Source: Datastream, Goldman Sachs Global Investment Research
Intro-pris i 3 måneder
Få unik indsigt i de vigtigste erhvervsbegivenheder og dybdegående analyser, så du som investor, rådgiver og topleder kan handle proaktivt og kapitalisere på ændringer.
- Fuld adgang til ugebrev.dk
- Nyhedsmails med daglige opdateringer
- Ingen binding
199 kr./måned
Normalpris 349 kr./måned
199 kr./md. de første tre måneder,
herefter 349 kr./md.
Allerede abonnent? Log ind her

