
Momentum melts down when Meta goes sober
The hottest trade on Wall Street suddenly looks a lot less comfortable. Goldman warns that negative summer seasonality, market broadening, and soaring factor volatility could turbocharge a momentum unwind just as positioning sits near five-year extremes. Meanwhile, Meta quietly fired what could become the opening shot of the next AI rotation: abandoning “drunken sailor CapEx” in favor of selling excess compute. The result? Mag7 stocks just posted their biggest single-day outperformance versus semis on record. If leadership is changing beneath the surface, these charts suddenly matter a lot more.
Unchartered territory
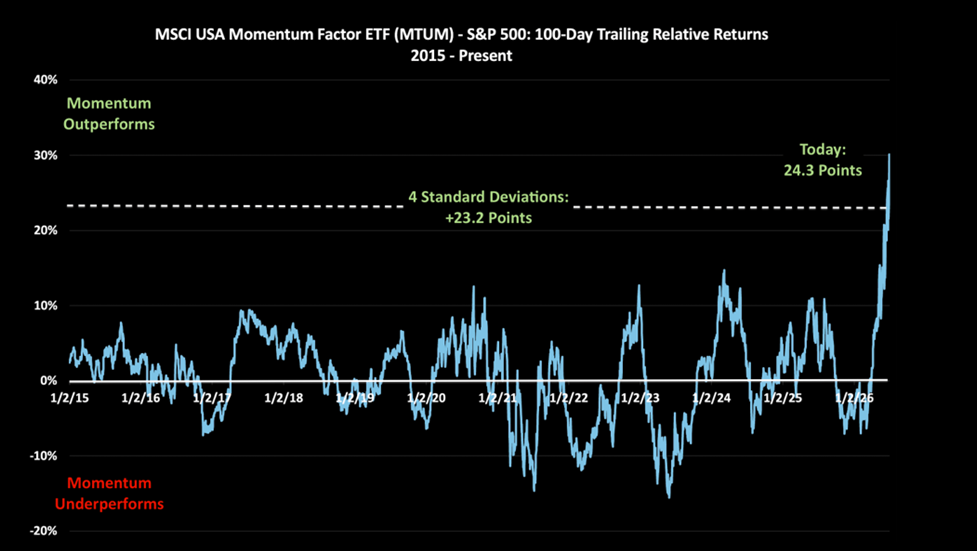
This is how Momentum (using the MTUM ETF as a proxy) has fared versus the S&P 500 in terms of trailing 100-day price returns back to 2015. Momentum is in uncharted statistical waters just now. This has been a very powerful and unprecedented rally, at least compared to the last decade.

Source: Data Trek
Elevated positioning
GS: “Momentum exposure in our Prime book remains very elevated, 92nd 5-year, 62nd 1-year”.
Extreme positioning rarely causes a reversal by itself—but it dramatically increases the market’s sensitivity to even small changes in narrative or leadership.
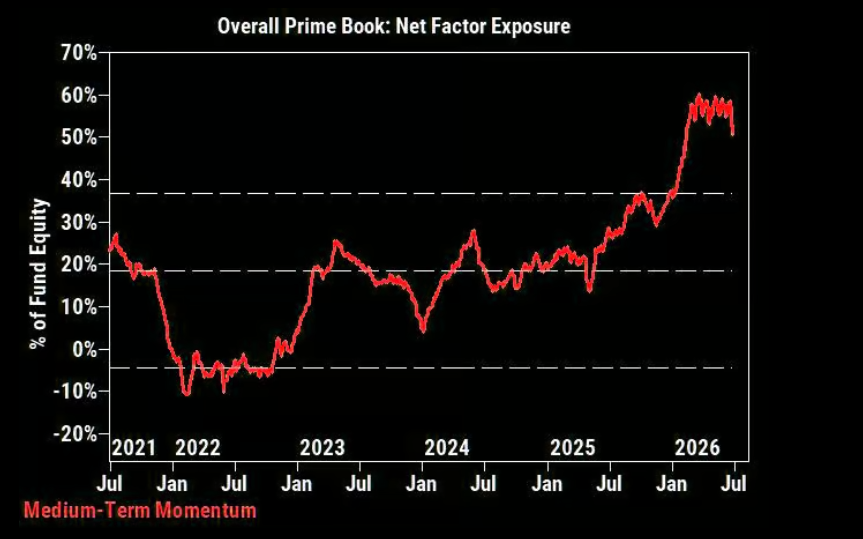
Source: GS Prime
Best of times…worst of times
The US Momentum pair enjoyed the 3rd strongest 1H on record, gaining 40%, but yesterday, the start of 3Q, saw a drop of 7.6%. That was the worst 1D decline in 5 months and the 26th worst day in the last 30 years.
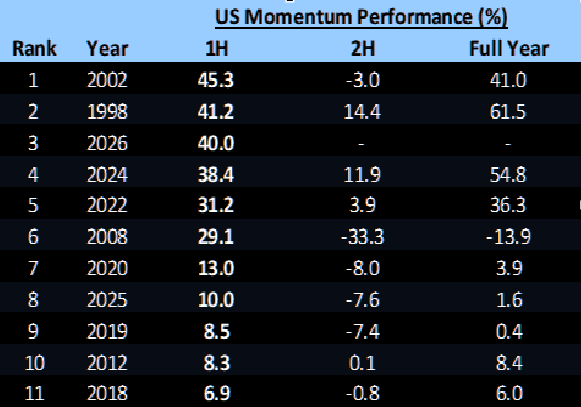
Source: Morgan Stanley
Only at major turning points
30D realized volatility on the US Momentum pair is now at 63.9, levels only previously seen in the TMT bubble unwind, the GFC & subsequent recovery and the post-Covid boom. While these periods include both big up and big down markets at the index level, the one commonality is that this level of MOMO volatility has only previously occurred at major turning points in US Momentum.
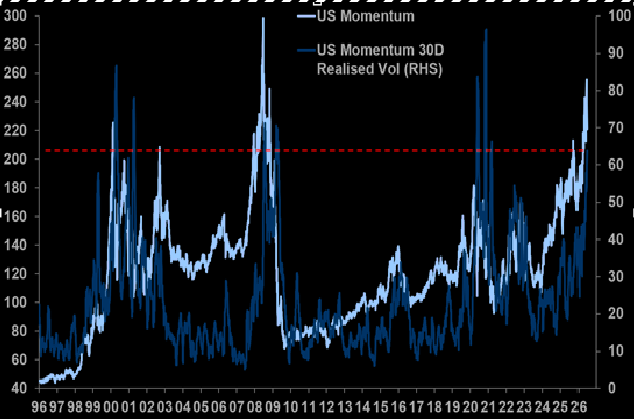
Source: MS QDS
TMT momentum & vol
US TMT Momentum was also down 10.7%, the 3rd worst day in history, pushing 30D realized volatility to record highs.
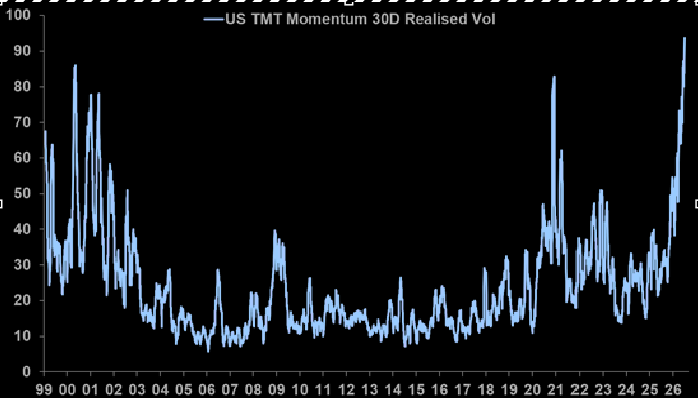
Source: MS QDS
Not since the TMT bubble
It is notable that the spread between the VXN and VIX hit levels not seen since the TMT bubble was bursting.
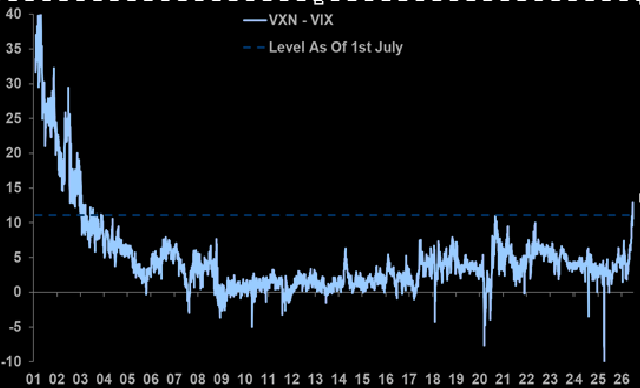
Source: MS QDS
History lesson
It is worth remembering that when looking at the Nasdaq, one thing that differentiated the record 102% gain of 1999 and the latter stages of the blowout top in 1Q 2000 was the shift in volatility. Nasdaq volatility consistently declined in 1999, but rose sharply ~3M before the actual peak in the index.
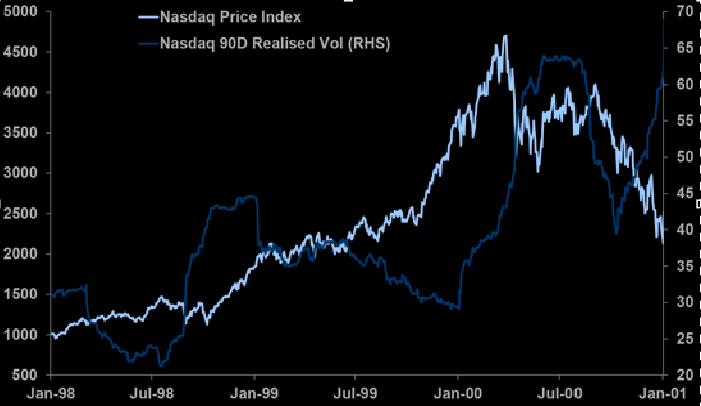
Source: MS QDS
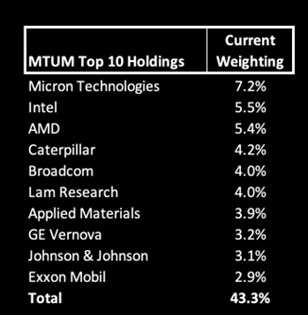
The stocks
As for the stocks and sectors that have driven Momentum’s remarkable run, here are MTUM’s top 10 single stock and sector weightings. The bulk (8 of 10) of the fund’s top 10 names are AI-related. The 2 exceptions are JNJ and XOM.