
Uddrag fra Bank of America
“BIG stuff” is happening, according to Michael Hartnett in his latest Flow Show report, and not just BIG in the metaphorical sense of his favorite 2025 trade (long Bonds, International and Gold, all of which continue to outperform, and all of which will also be discussed extensively later on), but literally.

As Hartnett writes in his “Biggest Picture” section, the BofA CIO starts out guns blazing with a summary of all the earth-shattering changes we are observing, in many cases without even noticing, to wit:
- End of US big government,
- Magnificent 7 to Lagnificent 7,
- Start of EU fiscal stimulus,
- end of Japan deflation,
- return of China consumer
To the BofA strategist, these are the “5 big inflection points”, all of which are weak US$ catalysts, all supportive of “BIG” Bonds, International, Gold; Meanwhile, surging global financials (as shown below) indicative positive big global stuff to offset peak US exceptionalism in coming quarters, and any trade war interrupts a big secular uptrend only temporarily (unless of course the trade war is even bigger than Hartnett expects).

Taking a closer look at recent events, Hartnett writes that DeepSeek, DOGE, and Trump geopolitics have been the big drivers in Q1, but looking ahead the BofA strategist thinks the focus on the April 2 trade “Liberation Day” (which Goldman has been hyping up breathlessly) is overplayed. Yes, US tariffs are set to jump from 2% to 8% of imports…

… but Hartnett expects Trump to underplay (not overplay) April 2nd to avoid 2nd wave US inflation; As such, Hartnett thinks that April 4th – when we get the March payroll number – more important to set April direction, and specifically the jobs print. To Hartnett, a soft landing 100-200k payroll = no recession = recent SPX 5.5k low holds (US retail/homebuilding stocks bounce); but a hard landing <100k payroll = SPX to new lows in April, taking global stocks, banks, credit down (and kick-starts big Trump pivot to tax cuts).
Meanwhile, US banks remain the “tell”:after credit had remained immune to the equity rollercoaster, the recent blow out in HY CDX to 400bps, coupled with the slide in the private equity basket (consisting of an equal weighted US private equity BX, KKR, CG, APO and bank stocks (JPM, BAC, WFC,C) by -22% in the past 2 months is “no bueno“. As shown in the chart below, Private Equity has joined CRE/small cap/housing needing quick/deep Fed cuts…

… and if the US bank index (BKX) fails to hold 120, “there be dragons.” In the meantime, flip-flopping Wall Street sentiment continues to sour (it is dictated day-to-day by price action so no surprises there) but the US put-call ratio yet to signal peak “fear.” Add to that the fact that the most frequently asked question among Hartnett’s clients is “what stops DOGE & tariff shock therapy?” shows investors are still not short risk (incidentally, Hartnett’s answer to the last question is : inflation jump in bond yields, lower Trump approval, GOP house losses, jump in unemployment in PA, WI, MI).
That covers BIG in the literal sense, and so let’s go back to the metaphorical BIG.
In this week’s Flow Show, Hartnett has dedicated a section analyzing the BIG 5 secular inflection points touched upon briefly above, and writes that Bonds, International, Gold are supported by the heretofore all-in global asset allocation toward “US exceptionalism”, US stocks & US dollar, which is now reversing via 5 secular inflection points, all of which consistent with a weaker US dollar.
Here are the five:
1. End of US Big Government
- US nominal GDP up exceptional 50% in past 5 years, aided and abetted by 65% jump in US government spending from $4.5tn to $7tn.

- Era of US fiscal excess over: US govt spending increased by +12% in past 12 months (+$750bn) but is mandated to fall -0.1% next 6 months, and Trump/DOGE are expected to enact bigger cuts to US budget in next 4 quarters; as we first warned two months ago, the contraction of the $7tn US government (3rd largest economy in world) means a. lower economic growth, b. lower payrolls, c. higher household savings, d. lower inflation into 2026. And yes, small US government bullish for US Treasuries.
2. “Magnificent 7” to “Lagnificent 7”
- US equities have led global equities & Magnificent 7 stocks have led US equities past 2 years; Magnificent 7 peaked at 35% of S&P 500 market cap in Dec’24 (up from 20% in Jan’23), but are set to become the “Lagnificent 7” in ’25.

- Popularity of “Magnificent 7” big tech monopolies (Dec’24 = peak 65x average trailing PE) driven by a. hunger for large cap quality growth stocks in ’23 and b. AI “baby bubble” in ’24; But the recent China DeepSeek shock means a. rotation to China’s BATX (Baidu, Alibaba, Tencent, Xiaomi) $1.5tn market cap from $15tn US “Magnificent 7”, b. pop in AI “baby bubble” = ’25 peak in hyperscaler AI/data center/power capex (5 big tech hyperscalers forecast to account for huge 20% of US capex or $333bn in ’25).

3. Start of European Fiscal Stimulus
- New US administration policies help prompt Europe to solve its 21st century dependence on China for exports, US for security, Russia for energy; Germany will lead the start of European fiscal stimulus; while in the past 75 years, the German budget deficit was 1.5% of GDP, going forward it will shoot up to 4-5% of GDP to fund $1.1tn in German fiscal spending next 4 years.
- Draghi, end of Russia-Ukraine conflict, infrastructure additional Europe fiscal spend catalysts; and of course the spending needs to be very big to restore depleted European military…in 2024 military personnel Russia 2.6 million, China 2.5 million, US 2.1 million vs. France 230k, Germany 213k, UK 211k…current German defense spend of $67bn per annum equivalent to just 7% of US defense spend, vs peak of 18% in 1979.

4. End of Japanese Deflation
- Japan land prices are up 2% YoY (fastest growth since Q3’91, follows 65% fall from 1991 to 2024; Japan CPI up 4% YoY vs average of 0.4% in past 30 years; Japan wage growth +5%, highest since 1991 (up 5%).
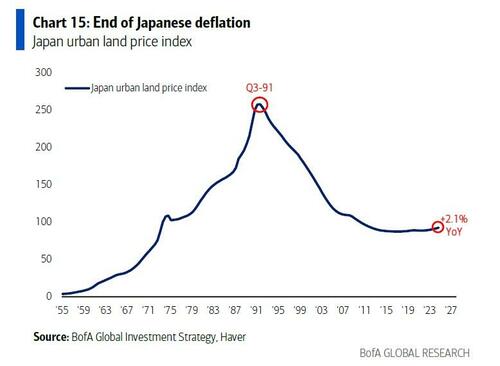
- Hartnett notes that in the past 30 years, Japan deflation anchored global bond yields, Japan has been source of funds for global capital markets; but this era is over as interest rates rise in Japan to combat politically unpopular inflation & weak yen (BoJ policy rate = 0.5%); Japanese bank stocks best symbol of end of Japan deflation – up 180% since 2019, means strong Japanese yen, weaker US dollar, raises floor for global bond yields…Hartnett believes US Treasuries the only bond market likely to see materially lower yields in ’25.

5. Chinese Exports to Consumption
- China economic reorientation from exports (20% of GDP) to consumption (abnormally low 40% of GDP, compare India/Brazil 60% & US 80%) set to accelerate in ’25; China economic policy focused on driving consumer spending higher via capital markets, property markets, and 4.5% GDP (~$800bn) policy stimulus in 2H’24.

- One other reason why Hartnett likes the exposure: China remains the most unloved global equity play yet China consumer recovering & tariffs win-win for China…light trade war already discounted and should heavy trade war threaten US recession, ultimately will lead to surprise US-China trade deal in 2H’25 (note both China retail sales & home prices on the rise.)
Next, we take a quick detour into the latest weekly flows data, which BofA summarizes as follows: $4.0bn to bonds, $3.2bn to gold, $0.5bn to crypto, $9.0bn from equities, $13.2bn from cash, and highlights the following details:
- Equities: $9.0bn outflow…largest YTD;
- US stocks: $20.3bn outflow…largest YTD, driven by domestic not foreign sellers; note YTD US equity funds still on course for record annual inflow ($541bn);
- Gold: $3.2bn inflow…big, driven by record daily inflow March 21st ($2.2bn);
- IG bonds: $2.3bn inflow…smallest inflow YTD;
- TIPS: $0.4bn inflow…past 4-week inflow ($1.8bn) biggest in 3 years;
- Europe stocks: $3.1bn inflow…largest 4-week inflow ($17.7bn) in 10 years;
- India stocks: $0.4bn…1st inflow in 3 months, largest since Sep’24;
- Tech: $3.1bn inflow…largest past 8 weeks;
- Real Estate: $1.6bn outflow…largest since May’22.
Hartnett also highlights the “Big Flow to Know”, which is also shown in the chart below: US household holdings of US stocks ($38tn) at record 29% of financial assets, and exceeding prior peaks in 1968 & 2000; Needless to say, 10-year annualized S&P 500 returns following 1968 (3.5%) and 2000 (-0.4%) were very poor.

The BofA strategist concludes with his asset recommendation matrix for the “Secular Contrarian”, writing that long-run returns of major asset classes show any secular contrarian should be long US Treasuries, UK stocks, global real estate, and short US large cap stocks; latest 10-year rolling returns (ranked highest-to-lowest)…
- US large-cap stocks 13.0% (down from 16.6% peak in Dec’21);

- US small cap stocks 8.4%
- Gold 7.9% (up from -1.5% in Sep’22)

- “60/40” portfolio1 7.2% (down from 11.4% in Aug’21)
- European stocks 7.1%
- Japanese stocks 7.0%
- Commodities 5.0% (up from -7.7% in Apr’20)

- ‘25/25/25/25’ portfolio2 4.6% (up from 3.8% in Sep’22)
- Real estate 2.7%
- Cash 1.8% (up from 0.3% in Mar’18)

- UK stocks 0.6%
- US Treasuries -0.2%: worst 10-year rolling return in past 100 years.