In Historic Reversal, China’s Credit Impulse Just Peaked: What This Means For Global Markets
Back in June 2017, we wrote that if one had to follow just one macro indicator that impacts virtually every aspect of the global economy, that would be the Chinese credit impulse. Not surprisingly, the article was titled “Why The (Collapsing) Credit Impulse Is All That Matters.” Then, a few years later just in case there was any confusion, we again wrote “Why The Collapsing Chinese Credit Impulse Is All That Matters.”
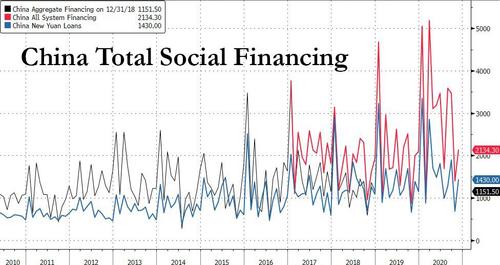
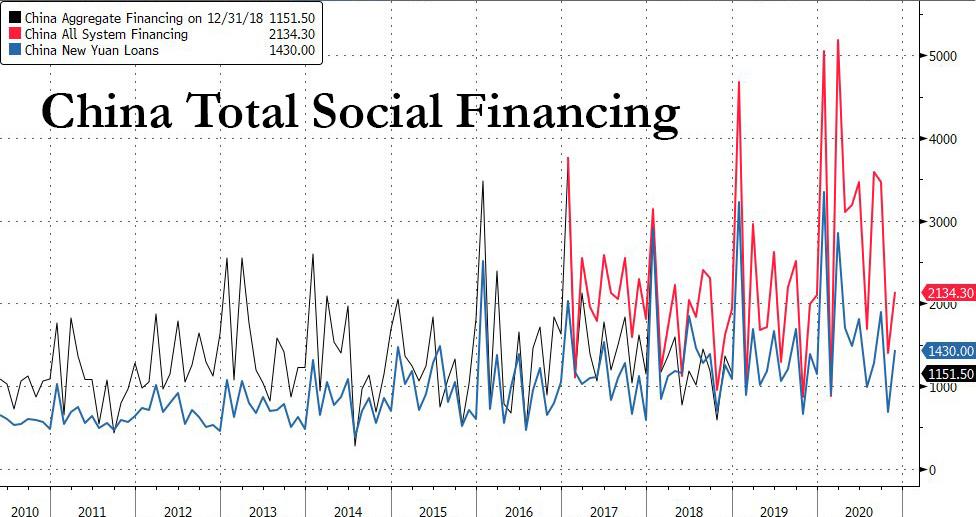
The reason for this is simple: with western central banks woefully unable to spark benign inflation both domestically or globally, China has emerged – starting around the time of the global financial crisis – as the only source of global economic and reflationary momentum, which in turn depends on China’s ability and willingness provide yet another stimulus to its domestic economy. It does so by injecting trillions of new credit into its financial system, as the following chart of Total Social Financing over time clearly shows.
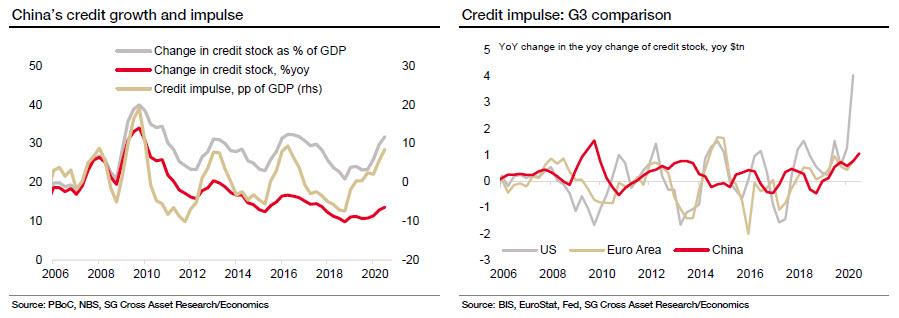
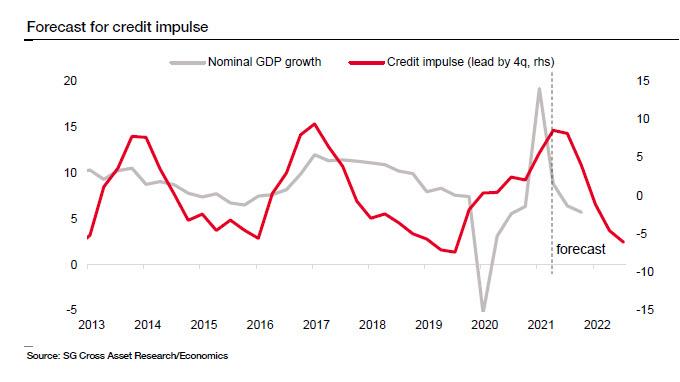
We bring all this up because as we have noted in recent months, and as SocGen’s Wei Yao writes this week, China’s credit impulse has been rising since early 2019 and is now close to its highest level post-GFC. And while the initial recovery in 2019 was a result of the fading impact of financial deleveraging, the surge this year is propelled by the counter-pandemic stimulus.
Since credit impulse is measured in percentage of GDP, the sharp slowdown in nominal GDP growth from 7.8% in 2019 to about 2.5% in 2020 has also helped the credit impulse record a much more notable pick-up than credit growth, which has climbed from slightly below 10% yoy end-2018 to over 13.5% yoy lately. Of course there is a cost” China’s debt-to-GDP ratio is on track to jump by more than 25% this year to 285%. However, in a surprising reversal, for the first time since 2008, the magnitude of China’s credit stimulus is not the largest in the world, as it is surpassed substantially by the US where the Fed will have monetized over $3 trillion in 2020.
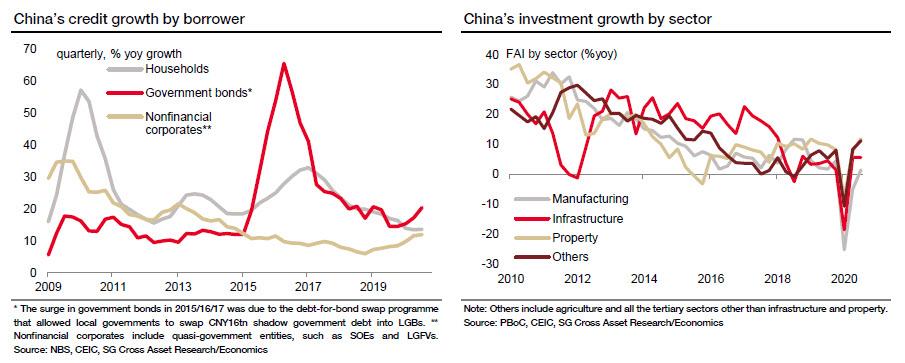
A quick breakdown where credit is being created: as SocGen explains, Chinese corporates account for 70% of the rise in the credit impulse in this upturn after bearing the brunt of the deleveraging campaign in 2017/18. Government borrowing accounts for the remaining 30%, as Beijing is ramping up fiscal support to the economy. Somewhat counterintuitively, there is nearly no contribution from the household sector, despite the quick and strong rebound in housing sales.
Given the three-quarter lead of credit impulse over economic growth observed in the past decade, the improvement in credit impulse so far is likely to support the economic recovery, in particular that of investment, well into mid-2021 at least. However, SocGen also note two unique features in this cycle that may limit the scale of investment acceleration in the coming quarters.
- Some of the credit impulse may just turn up as non-performing debt later. At the height of the pandemic crisis, the Chinese government and central bank pushed financial institutions to inject a substantial amount of credit into the corporate sector for the purpose of keeping affected companies afloat, just like in many other countries. Some of these companies have recovered and will invest if the economy continues to revive, but some of them may still go under. Notably, state-owned enterprise (SOEs) and local government financing vehicles (LGFVs), many of which had weak financial status entering the crisis have been among the major beneficiaries from the credit easing this year. Shortly after the PBoC embarked on policy normalisation, some of them defaulted on their bonds and shocked the entire bond market in November.
- The deleveraging mindset looks to be a lasting drag on public investment. Unlike in the previous easing cycle, infrastructure growth has been surprisingly limited in this recovery despite the generous expansion in government bond financing. After plunging 18.5% yoy in 1Q amid the lockdown, (traditional) infrastructure growth rebounded to 5.7% yoy in 2Q and has stagnated ever since. That pace is faster than the 3.8% in 2018 and 3.2% in 2019, but substantially slower than in any year before 2018. The main explanation seems to be local governments’ cautiousness over taking up much more shadow government debt (i.e. LGFV debt) for low-return projects.
Much more important, however, is SocGen’s contention that China’s credit impulse is about to peak and poised to turn down, as Chinese policymakers have shown every intention to resume the country’s derisking project. Since early 3Q, they have begun to shift their focus from fighting the crisis to risk control and long-term sustainability. The monetary policy stance has normalized to the extent that benchmark interbank rates and key bond yields are either close to or above pre-crisis levels. Furthermore, the fiscal impulse in 2H so far has also been smaller than budgeted, and the issuance quota for government bonds will probably be downsized in the 2021 budget. At the same time, SocGen notes that Beijing is mulling over a new deleveraging campaign targeted at housing and fintech. Even if the PBoC does not embark on an aggressive tightening cycle, “the combination of a smaller fiscal deficit, these targeted deleveraging programmes and potentially more credit events will likely already be enough to exert material downward pressure on credit growth in 2021″, according to SocGen.
* * *
Given all the factors above, SocGen expects the credit impulse to start moving dramatically lower at the turn of the year, from over +8% to around -7% end-2021, about as low as that seen in late 2018 when global stock markets suffered a major freakout. This projection assumes that credit growth will decelerate slightly slower than during the 2017-18 deleveraging campaign, from 13.5% y/y currently to barely above 10% y/y end-2021. Then, as nominal GDP growth is expected to rebound strongly in yoy terms, partly thanks to base effects, the credit impulse will likely see a steeper decline than credit growth next year. That said, the top risk to this forecast would be a more lenient policy stance on the back a softer-than-expected economic momentum. In this case, credit impulse would not shrink as fast
So what does all of this mean for global markets and the vast array of inflation-linked assets?
For the answer, we once again go back to SocGen which one years ago first analyzed how China’s credit impulse feeds through to inflation sensitive assets. The French bank studied correlations of these assets with the Chinese credit impulse (with a 1-year lag) and expected that a modest increase in the credit impulse should lead to a modest gain in reflation-linked assets over the next few quarters, which is what happened. However, understandably, the bank did not account for the Coronavirus pandemic which, after the initial setback, has since led to a further acceleration in Chinese credit growth over the full year.
As we approach the end of 2020, industrial metals are almost up 10% yoy, and Chinese sovereign bond yields as well as US 5Y forward 5Y inflation are both higher than their levels from last year. However, the year has not gone so smoothly for other inflation-sensitive assets such as eurozone banks (state-mandated dividend suspension), sovereign bond yields in Europe and the US (central bank forward guidance & quantitative easing), and value vs quality (tech-sector-linked performance differential).
This led SocGen to further explore the dispersion across inflation-linked assets; it is then that its Chinese analysts found that the performance of some assets (such as industrial metals) was more directly linked to Chinese credit impulse than others (such as value/quality), but it did not explore the possibility of varying lag times for different assets. In hindsight, the pandemic has made it obvious that the symbolic credit wave does not reach all the shores at the same time and does not have the same strength either. Overall, the manufacturing/industrial/durable goods sector has continued to exhibit the best pass-through of the credit-led inflation. This can be observed in the chart below, which continues to show a close link between Chinese credit impulse and US durable goods price inflation.
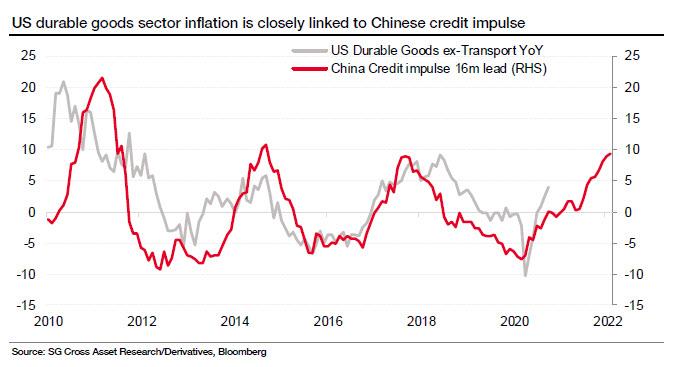
The relationship seen in the chart above is logical given that the pandemic has caused a shift in the composition of US household demand away from (mostly domestically produced) services and toward durable goods (mostly imported).
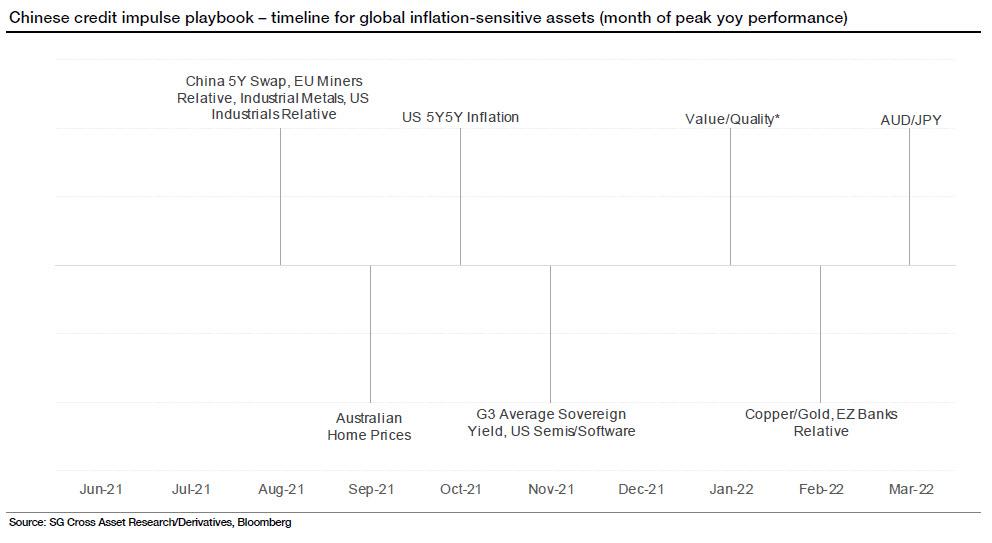
Next, SocGen analyzed the various lag times when calculating correlations (between inflation-linked assets and Chinese credit impulse), and the results confirmed initial expectations – of both this website and the French bank – that the credit impulse first reaches assets that are driven primarily by the Chinese economy (Chinese bond yields and industrial metals). Next to be impacted are inflation breakevens and sovereign yields in Western economies. The peak correlation for other growth-sensitive assets such as eurozone banks and AUD/JPY arrives with bigger lag of around 4-5 quarters. This result, while logical, is quite significant, as it gives us a playbook for the ebb and flow in Chinese credit impulse.
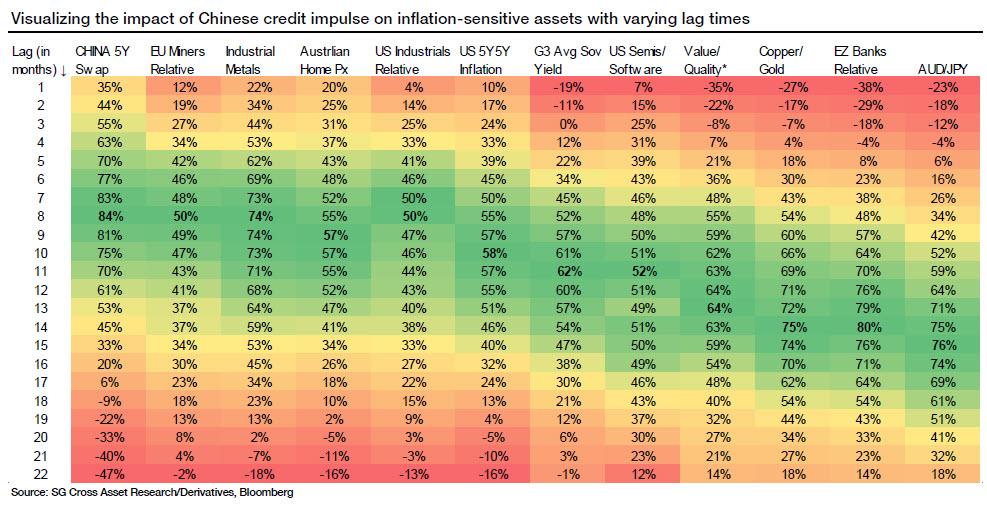
The table above shows the correlation between different assets and Chinese credit impulse for varying lag times. The extent of the differences between lags in correlations is exemplified in the left-hand chart below. While peak correlation for Chinese interest rate swaps arrives with an eight-month lag, the peak correlation for eurozone banks manifests itself with a lag of 14 months.
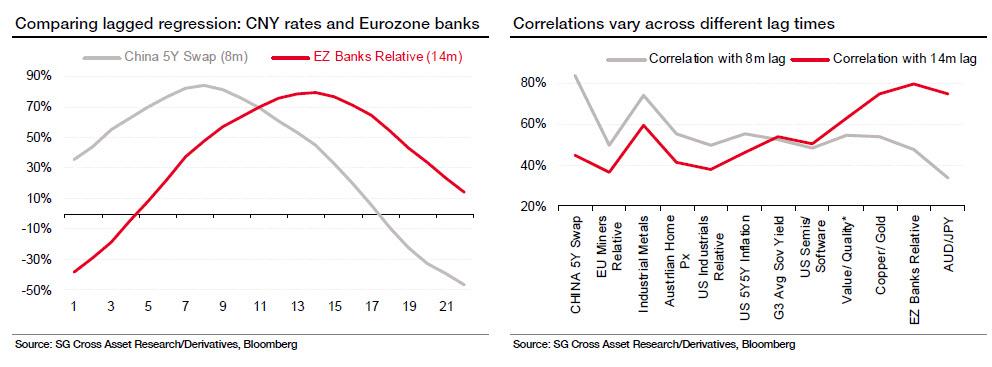
Comparing the correlations for two different lag times also shows interesting results. For a three-quarter lag (eight months to be more precise), Chinese interest rates and industrial metals exhibit the highest correlations with credit impulse. However, for a 14-month lag, Copper/Gold ratio, eurozone banks and AUD/JPY show the highest correlations.
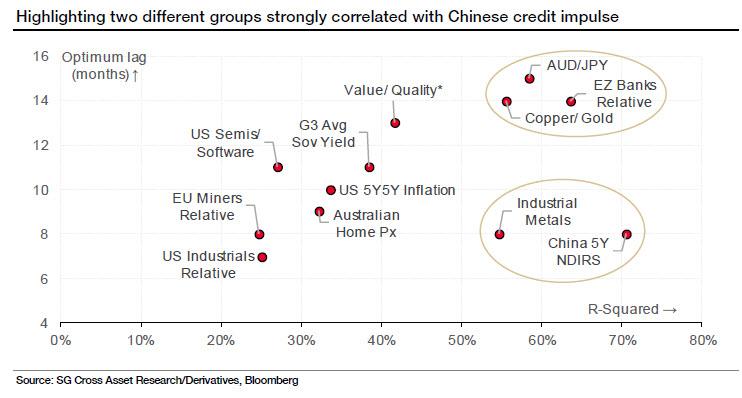
Looking ahead, with high correlations and short lag times, Chinese interest rate swaps and industrial metals should be the first assets to be adversely impacted by the topping of the Chinese credit impulse. Australian house prices and US 5Y forward 5Y inflation will likely also be hit in this first group.
The mining and industrial sectors also have short lag times, but their correlation is slightly lower. The other highly correlated group of assets, including eurozone banks, also gets strongly affected by credit impulse, but the rather large lag time opens the door for other factors to influence the price action of these assets as well.
Low correlation with certain assets suggests that Chinese credit, while being one of the drivers, may not be the main driver of price performance for these assets (e.g. semis/software ratio, sovereign yields in the West and value/quality ratio).
* * *
Next, we look at some of the assets most affected by China’s credit impulse, starting with Commodities/Commodities-linked assets.

Starting with commodities, SocGen notes that the broader industrial metals complex has a shorter lag (8m) to credit impulse than copper (15m). Moreover, copper prices seem to be running ahead of what credit impulse levels would suggest, implying less upside from here in the near term. However, industrial metals still point to a healthy double-digit gain over the next few quarters.
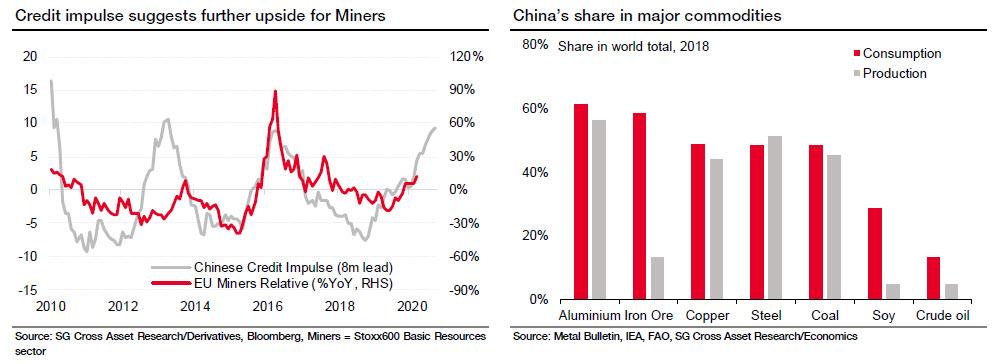
Based on SocGen’s analysis, if the credit impulse weakness is confirmed in 4Q 2020, the strength in the broader industrial metals complex to dissipate as we approach the second half of 2021.
Eurozone banks
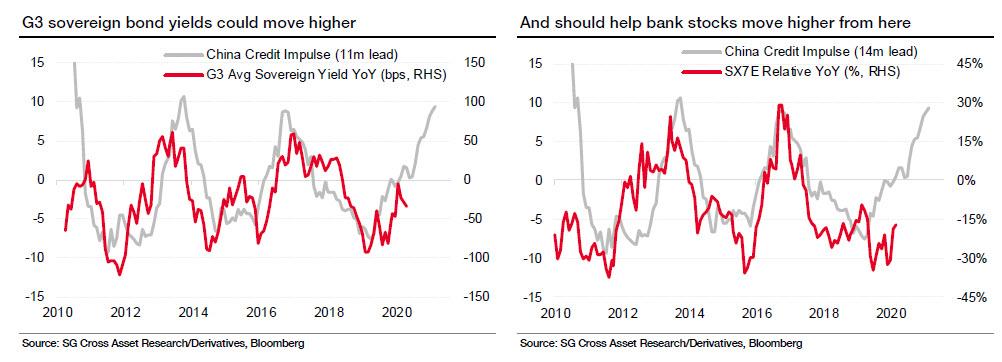
In addition to Commodities, there is a clear and strong feed-through from Chinese credit impulse to the Eurozone banks sector, whose long lag time of 4-5 quarters opens the possibility of other factors exerting strong influence on this sector. Nevertheless, as a base case, the credit impulse model suggests that banks should remain supported by the inflationary wave at least till the end of 2021.
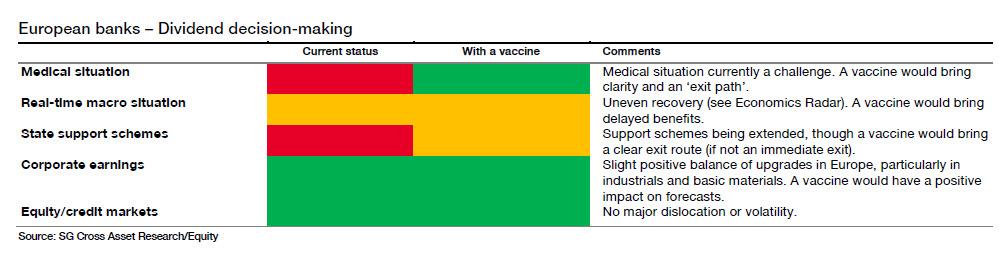
However, Chinese credit impulse is not the only tailwind for banks. A successful roll-out of vaccines against the virus should lead to less pressure on banking sector as the economy slowly goes back to normal. In terms of immediate catalysts, further clarity on capital redistribution at the upcoming ECB meeting should be a positive development for the sector. To quote the SG banks research team:
“The important part of the dividend communication is the signal that it gives. With distributions turned off, the implicit message from the ECB is that banks do not have sufficient capital and/or will be called on to provide further support to the real economy. Any softening of this stance, even with compromise caveats, would outline that the perception of capital has improved.”
The other imminent catalyst is the run-off elections in the state of Georgia for two US Senate seats on 5 January. If the Democrats win both seats, they will achieve a narrow effective majority in the Senate with Vice President Harris’ tie-breaking vote. This should lead to a repricing of the size of potential fiscal easing and should support the inflationary trend we have observed so far. Many bank sector-related assets should be beneficiaries of these two imminent catalysts, while the direct beneficiaries of further clarity on dividend istributions would be Eurozone banks dividend swaps.
Further clarity on distributions should support SocGen’s credit strategy team reco to be overweight financials vs non-financials in European credit, as banks’ provisions are high and supply is limited.
China sovereign bond yields
Not all assets are likely to be equally impacted by the credit impulse led reflation. In fact, we expect Chinese government bonds to exemplify the dispersion among risk assets given differing lag times. A confirmation of the Chinese credit impulse trend reversal should be quite significant for the trend in Chinese sovereign bond yields. With SocGen expecting the credit impulse to head into deeply negative territory by the end of 2021, and with one of the shortest lag times to this leading indicator, Chinese government bond yields have asymmetrical risks to the downside. The reversal in issuance trends should also help – the bank expects a ~30% reduction in overall bond issuance in China in 2021 compared to 2020. Foreign flows and a likely inclusion in FTSE WGBI (World Government Bond Index) are also potential tailwinds next year.
This trend is likely to contrast with the other large Western sovereign bond markets – especially the US where significantly higher long end rates as expected(SocGen forecasts end 2021 10Y TSYs @ 1.5% and 30Y TSYs @ 2.5%). The credit impulse framework also suggests a slightly delayed response from G3 bond yields (11-12 months), which suggests that the spread between US treasury yields and Chinese sovereign bond yields could tighten by the end of 2021 (after hitting a record wide in November). SocGen’s recently recommended this investment idea (long 10Y CGB against 10Y UST, with a target of +180bp and a stop of +260bp, current level +234bp).
Other inflation-sensitive assets
Barring a significant setback in the vaccine rollouts, SocGen expects a broad outperformance of inflation sensitive assets over the next couple of quarters… and then a reversal. As future expectations of inflation gradually move higher, financial conditions should remain easy given the negative real rate environment. Other assets such as value vs growth, semiconductors vs software and growth-sensitive currencies should continue to do well. However, the second half of 2021 should be the time to buy protection on some of these assets as credit impulse rolls off its elevated levels. This would be consistent with a turn lower in sovereign bond yields across the major economies by the end of 2021.
Key takeaways
To summarize SocGen’s views, the Chinese credit impulse reached a turning point in the current (Q4 2020) quarter, and will head lower next year. If this is confirmed by the upcoming data, expect a dispersion between inflation sensitive assets in 2021. Assets with larger lag times (e.g. Eurozone banks) will benefit from the residual reflationary trends for the next year, “but some assets with shorter lag times (such as CNY rates) will reverse their trend and follow credit impulse lower much sooner” according to SocGen.
In the chart below, SocGen provides a critical estimated timeline of the peak Y/Y performance for each of the assets analyzed in its recent research. While these assets are influenced by multiple factors and therefore could easily diverge from expectations, the chart below does present a neat output from a lagged regression analysis and is a useful guideline for next year.