
Fra Zerohedge
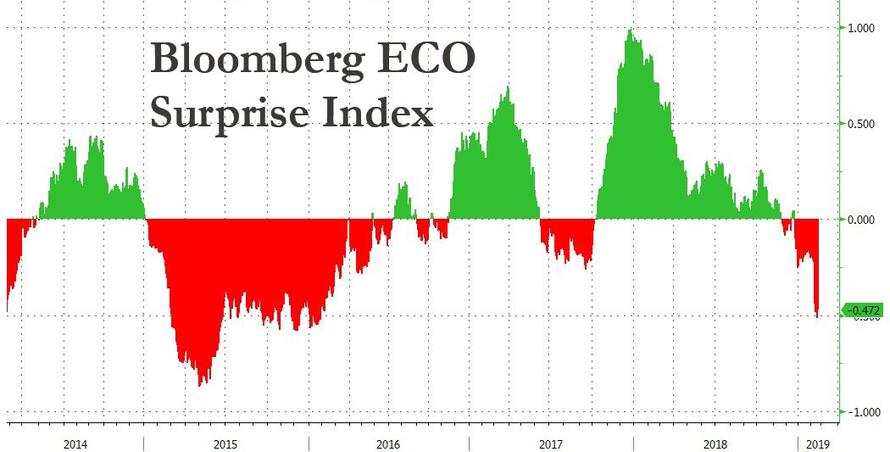
To say that the recent market moves have been confusing, would be an understatement: on one hand, the S&P500 is enjoying its best start to a year since 1987, even as the US economy continues to founder and the Bloomberg surprise index has tumbled to the lowest level in years, tracking the slowdown in Japan and Europe…
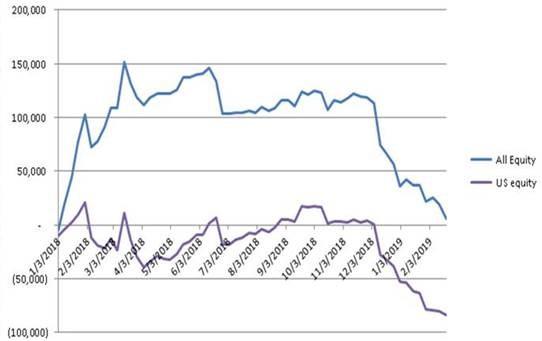
… as institutional investors continue to sell stocks…
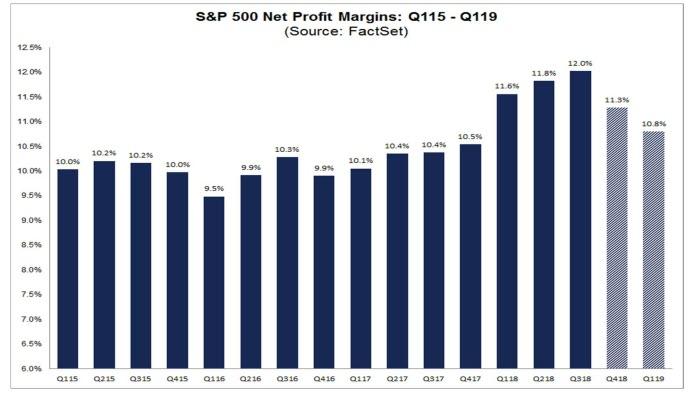
… and Q1 EPS are now pointing to an earnings recession as a result of peak margins hit in Q3 2018:
Of course, the upside catalysts for the market are now well-known and include not only the daily dose of US-China trade war “optimism”, a dovish reversal by the Fed coupled with fresh signs the central bank may revise its inflation targeting strategy, not to mention a record credit injection by China which in January created new debt amounting to 5% of China’s economy, more than the GDP of Saudi Arabia, not to mention ongoing record stock buybacks, a historic short squeeze, futures buying by speculators and CTAs going mach short (as Nomura listed earlier today).
While these factors have helped push the S&P500 above the critical 2,800 resistance level, there is very little conviction in the move. In fact, as BTIG’s Julian Emanuel told Bloomberg today, at a level slightly above 2,813, which is basically around the tops of highs in October, November and December, “people are actually hoping the market fails” because so many are lagging behind the strong year-to-date rally, adding that “if anything, the fear in professional investors’ mind is now of further upside” and since 2,813 is a triple top, “this would make it a quadruple top.”
So with confusion rampant, traders have resorted to technicals where, unfortunately, even more confusion emerges when one looks at the key 50-day moving average.
Recall that as PrismFP’s Mark Orsley observed last week, the level of the S&P versus its 50-DMA is severely extended. In fact, over the last 20 years, it has only been this extended twice.
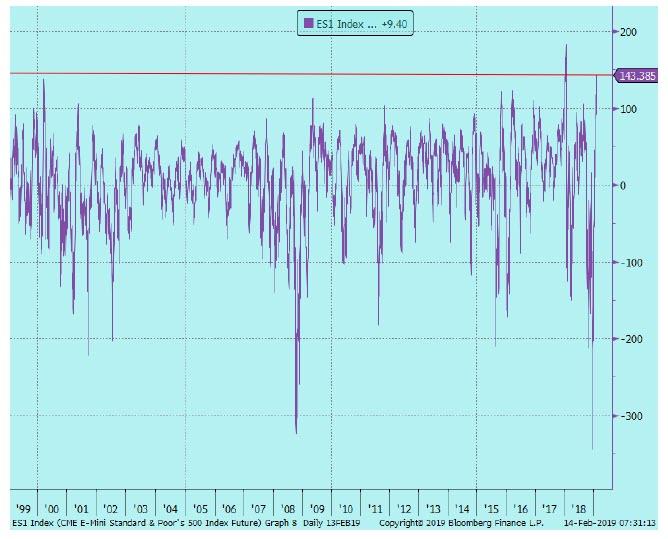
This is notable, because on both of those occasions the S&P suffered a significant, ~10% correction just one month later.

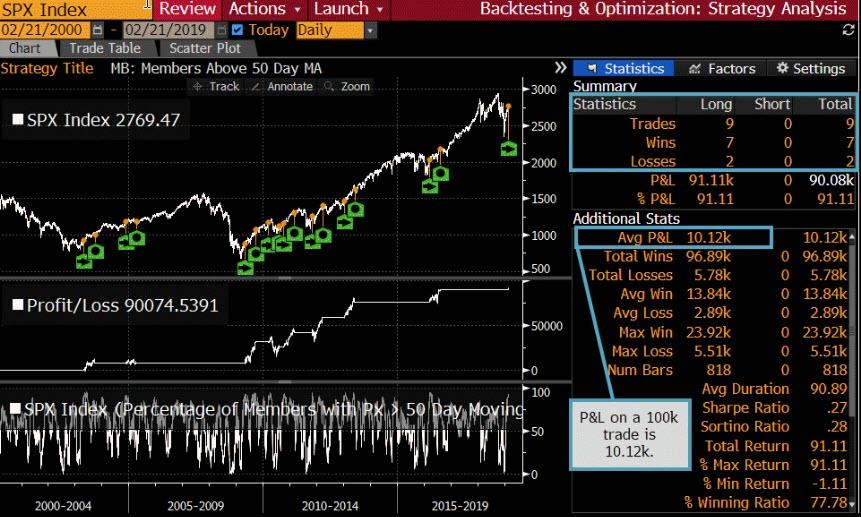
And yet a diametrically opposite observation about market performance can be made when looking at the performance of the S&P’s constituent members, or market breadth. According to Bloomberg, the S&P’s post-Christmas advance pushed more than 92% of SPX members above their 50-day moving average. That’s only happened nine times since the beginning of the millennium…
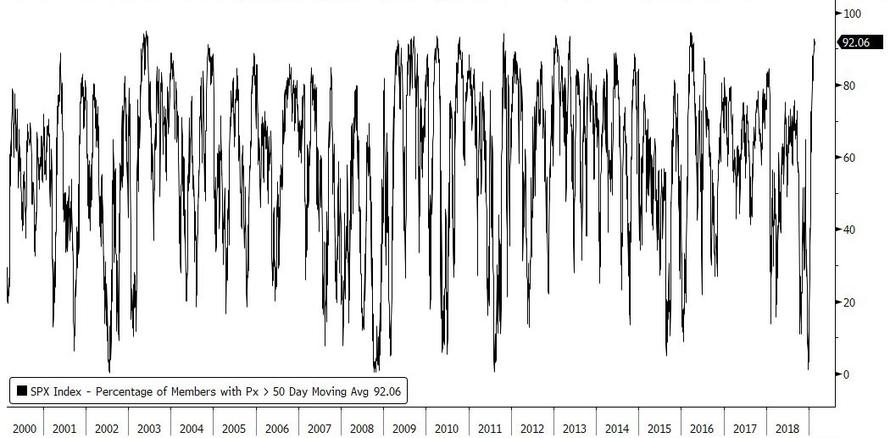
… but what is more bizarre, is that unlike the massively overbought signal noted above, this one actually has a happy ending, and as Bloomberg calculates, on average ever time 90% of the index were trading above their 50-DNA, the index has gained 10% over the following 100 days (for accuracy, on 7 of these 9 occurrences, the index was higher 100 trading days later).
So what happens to the market next based on its massively stretched breadth indicators, at either the index or single stock level? That depends: if one goes off how massively overbought the broader market is, the next move is down 10%. However, if one looks at the breadth of the market thrust, i.e. how many stocks are trading above their 50 DMA, the average return in 100 days is 10% more

