

Fra Zerohedge/ Citi / JP Morgan
The past few months can best be characterized as a period of unprecedented market optimism and sheer euphoria, and we have done just that with several recent articles…
- Dec 1: Market Euphoria Surpasses Dot Com Levels: What’s An Investor To Do?
- Dec 2: Citi Warns Most “Euphoric” Market Since Dot Com Bubble
- Dec 6: JPMorgan Warns Crowded Trades And Euphoric Consensus Are The Biggest Threats For Markets
- Dec 15: Record Wall Street Euphoria Triggers First BofA “Sell Signal” Since February 2020
- Dec 17: Euphoria Goes To 11: Futures, Global Markets, Bitcoin Soar As Dollar Collapse Continues
… and so on. But whereas in the recent past, the euphoria was always bounded by the upper limit reached during the insatiable buying spree of the dot com bubble, the first week of the year is when we went off the chart. Literally.
As the latest Citi Panic/Euphoria model shows, this week’s Panic/Euphoria jumped to a record 1.83 versus an upwardly revised 1.69 in the prior week.
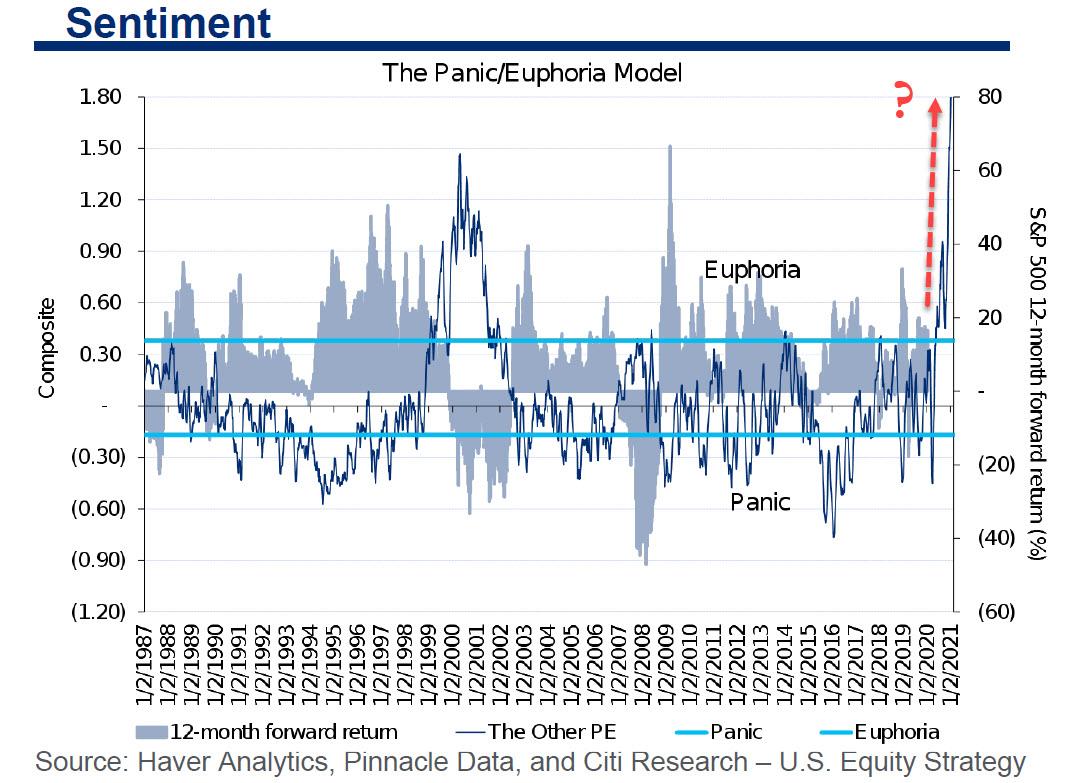
What does this mean? It’s simple: as Citi chief economist Tobias Levkovich writes when looking at market returns following previous euphoria extremes, there is now a “100% historical probability of down markets in the next 12 months at current levels.”
“Nasdaq Volume as % NYSE (though volatile), retail money market funds, margin debt, AAII & II bullishness, put/call premiums and NYSE short interest ratio all contributed to the elevated reading” according to Citi.
And just to make it extra confusing, in the same report Levkovich writes that “the normalized earnings yield gap analysis is 1.56 standard deviations below its 40-year average, yielding an 88% probability of higher markets in a year’s time, based on history.” So… 100% probability the market will be lower and 88% probability it will be higher: brilliant.
It wasn’t just Citi stunned by the record market euphoria: in his latest Flows and Liquidity report, JPM quant Nick Panigirtzoglou took a break from bashing bitcoin (well not really, more on that in a subsequent post, suffice to say anyone who listened to him and sold last Friday has missed out on 35% gains in the past week), and instead muses at the resilience of the market, driven by – what else – investor euphoria, to wit:
This week’s Democratic sweep added more fuel to risk markets and pushed US government bond yields to new highs. Neither the violent scenes from Capitol Hill nor the potential negatives from a Democratic sweep, i.e. tax rises and stricter regulations, managed to unsettle risk markets this week. Risk markets exhibited similar resilience in December. At the time, neither the lack of any new policy impulse by the Fed, pension fund rebalancing flows nor fears about the UK variant of the virus managed to unnerve risk markets.
What, according to JPM, explains this remarkable resilience of equity and risk markets more generally since December? The answer is simple: central banks, or rather liquidity, “which appears to be reverberating once again in an intense manner via retail investors, in a repeat to Q2 of last year.” Panigirtzoglou points to retail investors’ activity, especially that of younger cohorts, and says that as the “anticipation of further US stimulus checks”, or stimmies as they are better known…
… “this force is likely to be sustained over the coming weeks”, JPM says and points to several indicators of euphoric retail trader activity including record call option trading both on exchange, which is forcing yet another gamma-squeeze (or as JPM puts it “To the extent this accumulation of long call options by retail investors continues, it could eventually result in a rise in vol via the delta-hedging of accumulated short call option positions by dealers taking the other side, similar to last August”)…
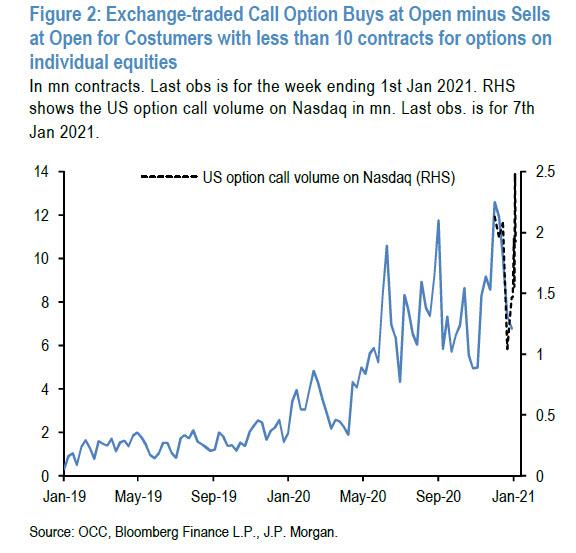
… as well as off.
To quantify the latter, JPM looks at the six main OTC market venues used by retail brokers: Virtu Americas LLC, Citadel Execution Services, G1 execution services, Two Sigma Securities LLC, Wolverine Securities LLC and UBS Securities LLC. The chart below shows the aggregate share to OTC transaction routed to different market venues (destination flow) by retail brokers, again as percentage of total US equity market volume. After slowing during the third quarter, US retail activity has “rebounded strongly in November.
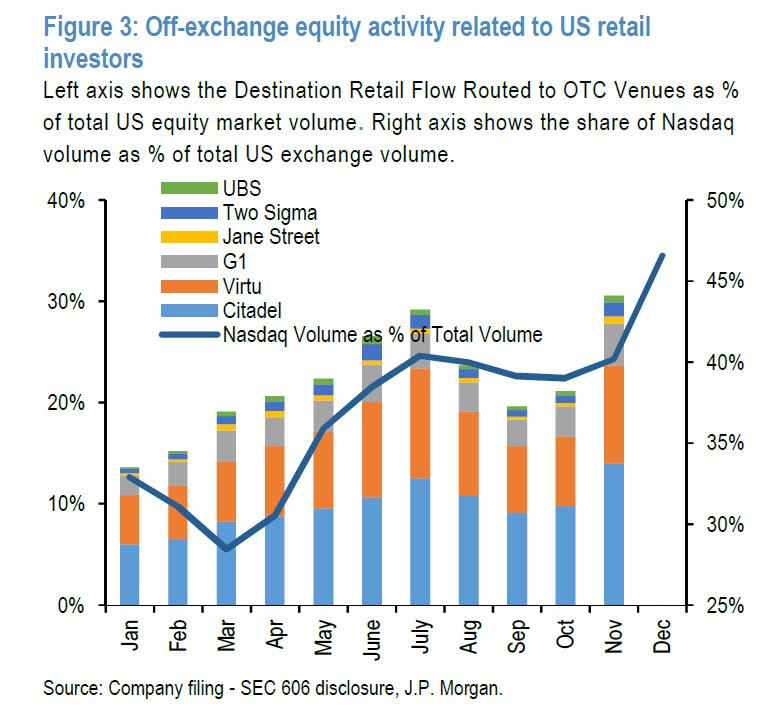
And this chart is only through November: one can only imagine that we will need a bigger chart for the December print here too.
In summary, JPM concludes that the record euphoria is due to “the liquidity force” – i.e., central banks and the latest round of fiscal stimulus – which “appears to be reverberating once again in an intense manner via retail investors, in a repeat of Q2 of last year. Given the anticipation of further fiscal support (e.g. additional US stimulus checks of $1400 to get to the original proposal of $2000), this force is likely to be sustained over the coming weeks.“