
The unemployment rate has been a perfect forecaster of a recession in the past 70 years, and it appears to be edging closer to triggering that signal. “It’s never been wrong. It’s something to watch,” said Joseph Lavorgna, chief economist for the Americas at Natixis.
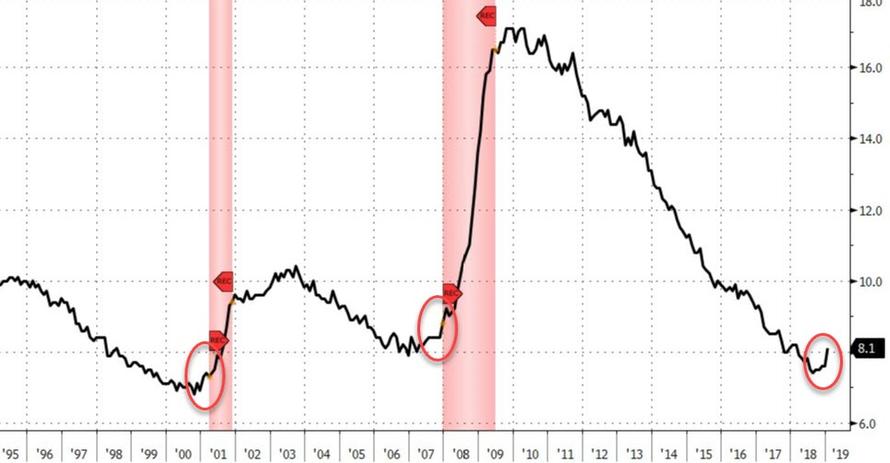
As the unemployment rate hovers around 4% (the number reported in the mainstream media) a more accurate unemployment number is 8.1%. This takes into account those who have given up on finding work and those who are underemployed (workers who are part-time but want full-time employment), This more accurate unemployment number is called the U-6, while we often hear the U-3 reported on the news. But even former Federal Reserve chair Janet Yellen says the U-6 is a much more accurate indicator of where things are with regards to the economy.
According to Lavorgna, since 1948, the economy has always entered or been in a recession when the unemployment rate increased 50 basis points (or 0.50 percentage point) from its trailing cyclical low. Lavorgna added that a recession has occurred in all 11 instances regardless of the level of unemployment, according to CNBC. He pointed to the example of a recession in 1953 when the unemployment rate rose to just 3.1 percent, and in 1981 when the cyclical low in the unemployment rate was high at 7.2 percent.
The unemployment rate which was reported February 1, rose to 4 percent in January from 3.9 percent. It is currently 30 basis points above the low of 3.7 percent reported in November. Based on simple math, the unemployment rate is close to triggering a recession indicator. But Lavorgna says the chances are still only 1 in 3 that that happens.
“The current rise is notable and would be troubling if it continues,” notes Lavorgna. “The recent increase in the rate has been due to rising labor force participation, which is a sign of economic strength, not weakness.”
According to CNBC, the reason the unemployment rate has risen is actually a good thing. The long-term unemployed are returning to the workforce and looking for a job. “Generally job growth is positive just before a recession,” said LaVorgna.
This isn’t the only indication that a recession is creeping up on the United States. Other signs are there if you choose to look past the glassy-eyed talking heads in the media. Retail sales were so bad in December of 2018, that many say it had to be “suspect data”and not the simple fact that the economy isn’t as strong as many would have you believe. If the data was not suspect than a recession is on the way. And with retail stores closing at an alarming rate, it isn’t surprising to hear retail sales have dropped
| Measure | Not seasonally adjusted | Seasonally adjusted | |||||||
|---|---|---|---|---|---|---|---|---|---|
| Jan. 2018 | Dec. 2018 | Jan. 2019 | Jan. 2018 | Sept. 2018 | Oct. 2018 | Nov. 2018 | Dec. 2018 | Jan. 2019 | |
U-1 Persons unemployed 15 weeks or longer, as a percent of the civilian labor force | 1.5 | 1.3 | 1.4 | 1.5 | 1.4 | 1.4 | 1.3 | 1.3 | 1.3 |
U-2 Job losers and persons who completed temporary jobs, as a percent of the civilian labor force | 2.4 | 1.8 | 2.3 | 2.0 | 1.7 | 1.8 | 1.7 | 1.8 | 1.9 |
U-3 Total unemployed, as a percent of the civilian labor force (official unemployment rate) | 4.5 | 3.7 | 4.4 | 4.1 | 3.7 | 3.8 | 3.7 | 3.9 | 4.0 |
U-4 Total unemployed plus discouraged workers, as a percent of the civilian labor force plus discouraged workers | 4.8 | 3.9 | 4.7 | 4.4 | 3.9 | 4.1 | 4.0 | 4.1 | 4.3 |
U-5 Total unemployed, plus discouraged workers, plus all other persons marginally attached to the labor force, as a percent of the civilian labor force plus all persons marginally attached to the labor force | 5.5 | 4.6 | 5.3 | 5.1 | 4.6 | 4.6 | 4.7 | 4.8 | 4.9 |
U-6 Total unemployed, plus all persons marginally attached to the labor force, plus total employed part time for economic reasons, as a percent of the civilian labor force plus all persons marginally attached to the labor force | 8.9 | 7.5 | 8.8 | 8.2 | 7.5 | 7.5 | 7.6 | 7.6 | 8.1 |
NOTE: Persons marginally attached to the labor force are those who currently are neither working nor looking for work but indicate that they want and are available for a job and have looked for work sometime in the past 12 months. Discouraged workers, a subset of the marginally attached, have given a job-market related reason for not currently looking for work. Persons employed part time for economic reasons are those who want and are available for full-time work but have had to settle for a part-time schedule. Updated population controls are introduced annually with the release of January data. | |||||||||