
Fra Zerohedge:
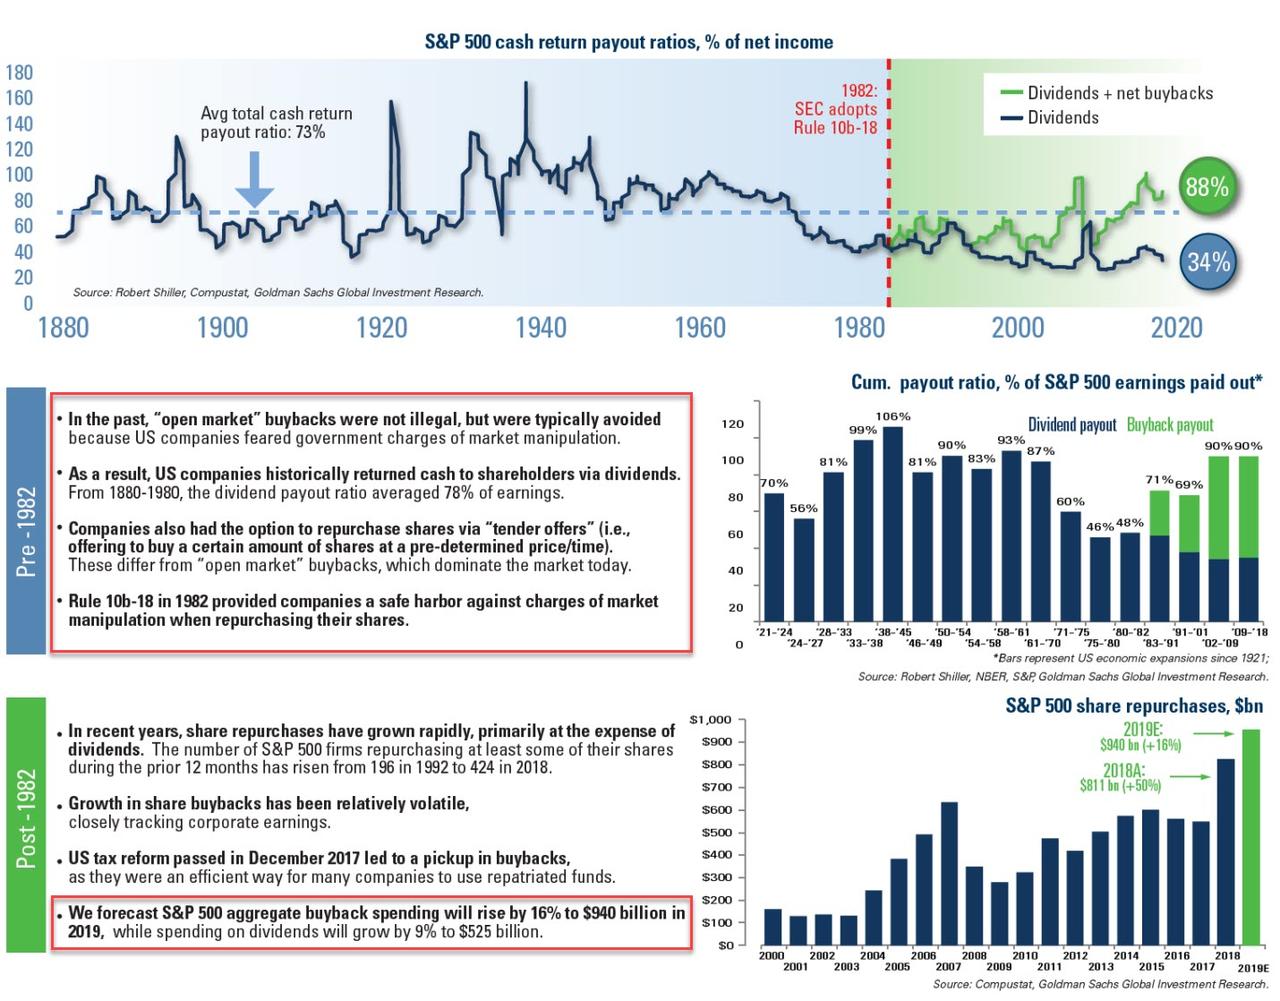
In short, buybacks were illegal until 1982 for a reason – market manipulation – and then they gradually became mainstream, with stock buybacks and dividends rising to 90% of the cumulative payout ratio of S&P 500 earnings in the 2002-2018 period. The cherry on top: in 2019, Goldman forecasts companies will spend a record $940 billion on buybacks (with $1.1 trillion in buyback announcements) up 16% from the prior record hit in 2018.
Some more staggering context: since the 2008 financial crisis, the S&P 500 companies have repurchased about $5 trillion of their own shares, which represents approximately 20% of the current market capitalization.
So while it remains to be seen if Congress will ban buybacks, one thing is certain: as Goldman’s David Kostin cautioned last week, without company buybacks, demand for shares would fall dramatically, for one simple reason: repurchases have consistently been the largest source of US equity demand.
Since 2010, corporate demand for shares has far exceeded demand from all other investor categories combined. Net buybacks for all US equities averaged $420 billion annually during the past nine years. In contrast, during this period, average annual equity demand from households, mutual funds, pension funds, and foreign investors was less than $10 billion for each category – despite the fact these categories collectively own 83% of corporate equities. Buybacks represented the largest source of equity demand in 2018. This is shown in the table below.

Then, overnight, Kostin reiterated this point, saying that “buybacks remain the largest source of net demand for US equities. Other ownership categories have been generally reducing equity exposure, including mutual funds.”
What this means is the following: with buybacks having become the most important marginal buyer of stocks, the one trading desk that dominates the daily flow of buybacks – which amount to just under $3 billion in gross purchases each and every day – has more influence on the overall market than even the NY Fed. And the person who controls that trading desk will be the most powerful person on Wall Street.
Meet Neil Kearns.
Kearns, a name few have ever heard of – certainly not a name on par with Stevie Cohen, Israel Englander, Larry Fink, Lloyd Blankfein, Jamie Dimon, Bill Dudley or any other hedge fund billionaire that is part of the Wall Street folklore – is the head of Goldman Sachs’ corporate trading desk: the desk the executes hundreds of billions in corporate buyback orders for clients all around the world. And with Goldman sporting the largest buyback trading desk on Wall Street, it wouldn’t be a stretch to say that – with the fate of the stock market in the hands of corporate buybacks – Neil is the most powerful man on Wall Street right now.
In its latest “Top of Mind” publication, Goldman sat down with Kearns, this “master of the buyback universe”, to address the size, impact, and outlook for US share repurchases. Since Neil is the man that sees more buyback dollars executed in any year than anyone else, he is just the right man to answer all buyback related questions.
Q: How large is the corporate bid in the stock market?
A: US corporates have been the largest net buyers of US equity for the last decade, repurchasing $5tn+ since the financial crisis. Last year, roughly $1.1 trillion of repurchases were authorized, with about $900 billion actually repurchased. As a share of the overall trading footprint, that’s around 6-7% of average composite volume, which might be viewed as a slightly underwhelming number. But companies repurchase stock under rule 10b-18, a safe harbor enacted by the SEC in 1982 to provide companies an affirmative defense against accusations of stock price manipulation. This rule provides volume, timing and price limitations on how companies buy back stock. Pulling out the non-eligible volume, the trading footprint increases to about 10% on average, and into the teens during market weakness.
Q: What is the major driver of volatility in share repurchases?
A: The largest driver of share repurchase volatility is broader equity market performance. In particular, the corporate bid tends to become more aggressive in a falling market as fundamental investors move to the sidelines. In periods of extreme dislocation, like we witnessed at the end of last year, repurchase activity can temporarily spike by multiples of average levels, as companies take advantage of attractive price points/valuations, and which may ultimately also have a secondary effect of tempering price volatility. That said, companies are cognizant of their trading footprints and generally aim to be less than 10% of trading volume.
Q: How much seasonality is there in share repurchases?
A: There is not a great deal of seasonality. Q1 tends to be the lightest quarter of activity—about 23% of total annual notional— given that companies have the least visibility on what earnings will look like that year. Q2 tends to be a little bit more active at around 24%, while the last two quarters average around 26 to 27%, as companies feel more confident in repurchase levels given greater clarity on earnings strength/cash flow generation in the second half of the year.
Q: We are in the midst of a blackout window for share repurchases, which occurs four times a year around quarterly earnings. Does that mean companies can’t buy stock?
A: No. The other rule relevant to share repurchase programs is 10b5-1. The SEC enacted this rule in 2000 to provide senior executives, who have a desire to sell equity, an affirmative defense to any charge of insider trading, by adopting a written plan to sell at a time when they are not in possession of material non-public information (MNPI). The plan is a written contract between the individual and their broker, and contains very specific instructions on trade dates, sale parameters, etc. Though the plan may extend through a blackout window when the individual possesses MNPI, because it’s ultimately on auto-pilot, the executive is protected. Companies have applied this same safe harbor to buyback programs, enacting plans before the blackout window that will run on auto-pilot during the window. Very little public information is available on 10b5-1s, but an internal analysis of 350 companies suggests that approximately 85% of companies utilize them to continue to purchase stock during closed windows. Companies do tend to be more conservative than in the open window (when they have access to real time information); we observe a notional spend reduction of ~30% during the blackout window.
Q: How do companies judge the success of their stock repurchase programs?
A: From an execution standpoint, most companies judge the success of their program by comparing the average price at which they’ve purchased their shares on any given day, to the volume weighted average price (VWAP)—a daily benchmark that is readily available on Bloomberg. If their purchase price is below VWAP, they’ve “saved” money. Given the billions of dollars spent annually on share buybacks today, senior management and more frequently, corporate boards, have become increasingly focused on execution performance versus the daily benchmark, in some cases adjusting the structure of their program to specifically achieve this. In my view, this narrow focus on daily VWAP has the potential risk of missing more attractive valuation opportunities.
Q: How would you judge investor focus on stock buybacks today?
A: Focus from the buy side community is at an all-time high, with investors frequently questioning whether the very strong corporate bid we’ve observed over the past decade will persist, and looking at this as a potential harbinger of equity market performance. But if investors are looking to share repurchases for market direction, they are probably one or two quarters behind; corporate earnings drive share repurchases—not the other way around.
Q: Do you see any evidence that the corporate bid is diminishing, especially given increased focus in Washington, DC?
A: Not currently. Share repurchase authorizations are up approximately 13% yoy, which is remarkable given the surge in buybacks last year. And more broadly, the US economy continues to do reasonably well, the Fed appears to be on pause, and US-China trade negotiations are moving in the right direction. So we have little reason to believe that US corporates will not continue to generate strong free cash flow, which, as I mentioned, has historically been the primary driver of stock repurchases
