Fra Zerohedge:
The biggest question we had ahead of today’s unprecedented GDP drop was “how do we show it on a chart without losing the impact of all other prints?” Well, for better or worse, this is the best we could come up with: at -32.9% annualized, Q2 GDP just plunged by the most on record, surpassing the previous biggest drop of -10% hit in 1958.

And while the drop – which was generally priced in – was some 5 times worse than the adjusted Q1 GDP of -6.9%, it was just fractionally better than the -34.5% expected. Then again, with a third of the US economy effectively going offline in Q2, a worse outcome than during the great depression, a few percent here and there doesn’t really matter.
The second-quarter decrease in real GDP reflected decreases in consumer spending, exports, inventory investment, business investment, and housing investment that were partially offset by an increase in government spending. Imports, a subtraction in the calculation of GDP, decreased.
That said, the biggest contributor to the overall GDP drop was the crash in consumption – the decrease in consumer spending reflected decreases in services (led by health care) and goods (led by clothing and footwear).

Breaking down the components of GDP we get the following:
- Personal Consumption accounted for the bulk, or -25.05%, of the overall -32.9% GDP drop, and 5x more than the -4.75% Q1 GDP drop
- Fixed Investment subtracted another -5.38% from Q2 GDP, far worse than the modest -0.23% drop in Q1. Nonresidential fixed investment, or spending on equipment, structures and intellectual property fell 27% in 2Q after falling 6.7% prior quarter
- Change in Private Inventories subtracted another -3.98%, 3x more than the -1.34% in Q1
- Net Exports contributed 0.68% to GDP, consisting of a -9.38% drop from Exports offset by a 10.06% boost from imports. The decrease in exports primarily reflected a decrease in goods (led by capital goods).
- Government consumption was a paltry 0.82%, up from 0.22% in the previous quarter

For those following the PCE data, the GDP price index fell 1.8% in 2Q after rising 1.4% prior quarter; core PCE q/q fell -1.1% in 2Q after rising 1.6% in the prior quarter.
Meanwhile, even though we already knew this, real disposable personal income (DPI)—personal income adjusted for taxes and inflation—increased 44.9% in the second quarter after increasing 2.6% in the first quarter. The increase in DPI was more than accounted for by an increase in personal current transfer receipts – i.e., government social benefits. Personal saving as a percent of disposable personal income was 25.7 percent in the second quarter, compared with 9.5 percent in the first quarter.
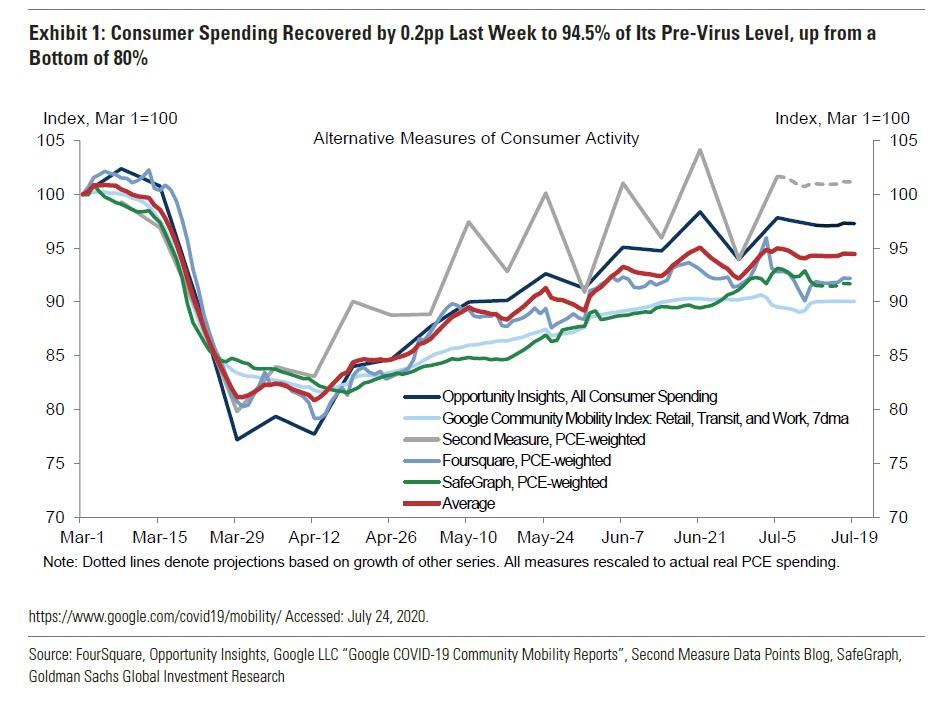
That said, the GDP collapse was expected, and in fact may be spun as “better than expected.” The real question is what happens next, and is Q3 the V-shaped recovery quarter. Alas, as both the Fed yesterday, and we showed last week, the high frequency data indicate that the US economy peaked in late June and is once again rolling over.